Become a MacRumors Supporter for $50/year with no ads, ability to filter front page stories, and private forums.

kartcrg

macrumors member
Original poster
Dec 7, 2016
59
13
Los Angeles
My 12 core 3.46ghz 5,1 Mac Pro with 48gb of ram is still a beast for CPU rendering. However, with its GTX 680, Fusion 360 viewport navigation performance is much worse than my iMac & MacBook Pro (GTX 780M & Radeon Pro 460). All 3 are 4gb graphics cards. EDIT: GTX 680 is a 2GB card. Heck, even the new 13" MBP has better viewport performance with its integrated graphics..

Only on the Mac Pro do the edge lines disappear during view movement and take a second to reappear once movement stops. Unchecking "limit effects during navigation to maintain framerate" leads to an unusable framerate. The latest nvidia web driver for the card makes no difference.

I wouldn't consider 3D CAD view movement to be super GPU intensive so any insight here would be much appreciated. Do I need to upgrade the graphics card?
 
Last edited:
I don't know the application you're using, but I'd guess you're limited by the single-thread performance of your CPUs. There's sadly no way to improve it, as you're already running the 3.46GHz Xeons.

You might have better luck with an AMD GPU, as their drivers tend to have a lower CPU overhead than Nvidia ones. It's just my personal observation though, might not apply to your setup.

Appreciate the insight, I had the same thought and I hope its not the case. The app "supports multi-threading" but I don't know how to see how many cores its using and to what percentage. Is there a way to tell if its a CPU bottleneck?

Edit: Just found the floating CPU usage indicator. Would one of the core graphs be maxed out if that were the issue?
 
Last edited:
The OpenGL calls are usually done from a single thread, which can bottleneck the overall system performance.

Proving this with usual tools might be difficult though, as they're usually providing an average over time, so the issues might not be notable. That single "OpenGL thread" isn't necessarily always executed on the same CPU, so observing the load of all separate cores isn't meaningful either. If one of the core graphs is running at 100% you could be quite sure that this is your problem though...
 
You can also get Xcode and run the "OpenGL Driver Monitor" inside Instruments. Enable "CPU wait for GPU" and "GPU Core Utilization" counters and change from log to linear scale with a max of 1G. If you don't see the GPU utilization pegged at 100 % (scale on the right) then you are CPU limited, and the age of the cMP CPUs is showing.
 
My 12 core 3.46ghz 5,1 Mac Pro with 48gb of ram is still a beast for CPU rendering. However, with its GTX 680, Fusion 360 viewport navigation performance is much worse than my iMac & MacBook Pro (GTX 780M & Radeon Pro 460). All 3 are 4gb graphics cards. Heck, even the new 13" MBP has better viewport performance with its integrated graphics..

Only on the Mac Pro do the edge lines disappear during view movement and take a second to reappear once movement stops. Unchecking "limit effects during navigation to maintain framerate" leads to an unusable framerate. The latest nvidia web driver for the card makes no difference.

I wouldn't consider 3D CAD view movement to be super GPU intensive so any insight here would be much appreciated. Do I need to upgrade the graphics card?


CAD Programs run best on workstations with workstation GPU´s. Fortunately you have two great options, at least in theory. If CAD is your major application, I would recommend to search eBay for the Nvidia Quadro K5000 Mac Edition.This is the traditional and best card for your application. However they are very rare and carry a high price tag. I am convinced though, you could be lucky if you spend the time to monitor eBay for 4 weeks or longer. The card comes as an official Mac Editon (PNY) which is real great.

Your alternative would be a Nvidia 980 ti card that has been flashed with an Mac EFI rom, such as those from MacVidCards. My own 980 ti helped me to move my old 5,1 to a VR computer to run the Vive goggles. To my surprise, it runs real great. I used to have the 680 Mac Edition and I can really tell you, - there is a big big gap to the 980 ti. Its a lot more quiet and a lot more powerful. The argument of the "weak single thread" CPU performance it true on paper, however I did not suffer any problems so far. A powerful GPU is far more important and will help to compensate for an ageing CPU.
If I would be in your shoes, I would absolutely NOT retire a 12 x 3,46 GHz 5,1 super rig. In my personal view, you most likely have THE best computer, Apple ever developed.
 
  • Like
Reactions: kartcrg and bernuli
like Fl0r!an mentions the visual graphs can be misleading, when watching cpu use in activity monitor if you see the the apps cpu use stuck say
100% that tells you it's only using one core (single core speed limited)
if you see something like 134%-190% your using 2 cores and id gess one core has one big task taking 100% and the second is doing smaller simple jobs only taking 90% (it may also be one task taking 1 core then lots of small tasks split over a bunch of cores)

it's normal for an app to split work loads up in to sections and shoot them of to different cores but if one task is not able to be split up then only one core will work on it and you will be limited by the speed of that core.
so yes the app is multi threaded but if it cant split up big jobs over multiple cores then you will be limited by the speed of the single core.

ps the macpro cpu is old now and slow by today speeds most 4cores will beat it by a lot

may also be something simple like the job is using your hard drives a lot and is limited by the speed of the drives (in adobe apps a SSD scratch disc can help a lot), the newer imacs/laptops have relay fast SSD's (they also have pci3 + faster cpu's)
 
  • Like
Reactions: kartcrg
CAD Programs run best on workstations with workstation GPU´s. Fortunately you have two great options, at least in theory. If CAD is your major application, I would recommend to search eBay for the Nvidia Quadro K5000 Mac Edition.This is the traditional and best card for your application. However they are very rare and carry a high price tag. I am convinced though, you could be lucky if you spend the time to monitor eBay for 4 weeks or longer. The card comes as an official Mac Editon (PNY) which is real great.

Workstation GPUs are great for CAD stuff solely because of their highly optimized drivers. Are you 100% certain these optimized CAD drivers even exist for OS X?

I've not seen a single OS X benchmark so far where a workstation GPU performed even slightly better than it's consumer equivalent in any pro application.
 
  • Like
Reactions: kartcrg
The simplest solution here is that the ancient CPUs in the cMP can't feed enough work to the GPU, and thus performance will be much worse than you'd hope/expect. This is a very common trend, given the age of the cMP.
 
  • Like
Reactions: kartcrg
Thanks for all the insight guys. Even if a $400 or $800 dollar card solves this bottleneck, I don't feel great about throwing money at such old tech.

Maybe I should offload the cMP while I can still get some money out of it. The only problem is that I don't know where to go.. This machine is primarily used for CAD model rendering, but I'd like to be able to use it for modeling too. The ray tracer I use, Keyshot, is a CPU renderer. It's speed is pretty much directly correlated to the number of cores / speed of cores. What I don't know, is how much of a difference modern processor architecture makes (besides being more energy efficient). For reference, the CMP has about twice the frame rate in Keyshot than that of my maxed 15" tbMBP (but I would not leave my MBP running at max CPU load for days at a time, I need a dedicated rendering machine at times).

So it seems like I have no good options:

-keep cMP for a few years, buy another graphics card, and pray for a nnMP with dual CPUs (by far the most expensive option)

-spend $5k on a 12 core nMP (I don't think there's any way I could spend that much $ on 2012 tech)

-sell cMP for ~$2k and get a more modern windows workstation (windows makes me want to throw up)


Ugh. Why Apple, why...
 
Can you install some CPU/GPU monitoring software? A bunch of people are speculating at the bottleneck, but it would be nice to see what it is for sure before making an expensive decision. It could be very informative.

xrg-screenshot.png
 
Can you install some CPU/GPU monitoring software? A bunch of people are speculating at the bottleneck, but it would be nice to see what it is for sure before making an expensive decision. It could be very informative.

xrg-screenshot.png

Definitely will! I should have some time this evening.
 
To start, here is how the activity monitor cores indicators look during viewport navigation.

screen-shot-2017-01-10-at-7-22-20-pm-png.682923


Downloading Xcode now.
 

Attachments

  • Screen Shot 2017-01-10 at 7.22.20 PM.png
    3.7 MB · Views: 346
Yeah that could easily be 1 thread consuming 1 effective CPU core but the OS is time slicing it across all the CPUs to balance the thermal load. Not the best visualization unfortunately.
 
  • Like
Reactions: kartcrg
I got Xcode and I don't see "Open GL Driver Monitor." I do see "Open GL ES Analysis" but I have no idea how to use it or what to do.
 
Thanks for all the insight guys. Even if a $400 or $800 dollar card solves this bottleneck, I don't feel great about throwing money at such old tech.

Maybe I should offload the cMP while I can still get some money out of it. The only problem is that I don't know where to go.. This machine is primarily used for CAD model rendering, but I'd like to be able to use it for modeling too. The ray tracer I use, Keyshot, is a CPU renderer. It's speed is pretty much directly correlated to the number of cores / speed of cores. What I don't know, is how much of a difference modern processor architecture makes (besides being more energy efficient). For reference, the CMP has about twice the frame rate in Keyshot than that of my maxed 15" tbMBP (but I would not leave my MBP running at max CPU load for days at a time, I need a dedicated rendering machine at times).

So it seems like I have no good options:

-keep cMP for a few years, buy another graphics card, and pray for a nnMP with dual CPUs (by far the most expensive option)

-spend $5k on a 12 core nMP (I don't think there's any way I could spend that much $ on 2012 tech)

-sell cMP for ~$2k and get a more modern windows workstation (windows makes me want to throw up)


Ugh. Why Apple, why...
Go Pc then. It will solve your problem.
 
To start, here is how the activity monitor cores indicators look during viewport navigation.

screen-shot-2017-01-10-at-7-22-20-pm-png.682923


Downloading Xcode now.

You should check the Activity monitor's CPU section, but not this graph. CPU single core limiting doesn't mean that one of the core will show 100%. There are million's of calculation in a second. The result from one core can be passed to another core to continue the calculation. In this case, it's still limited by the single core performance, but the graph will shows more than one core is working (but not to 100%).

In most CPU single core performance limiting cases, you normally can see something like this. A process that demanding something a bit more than 100%. However, this is also not 100% accurate as well.
Screen Shot 2017-01-10 at 22.04.26 copy.jpg
 
  • Like
Reactions: kartcrg
You should check the Activity monitor's CPU section, but not this graph. CPU single core limiting doesn't mean that one of the core will show 100%. There are million's of calculation in a second. The result from one core can be passed to another core to continue the calculation. In this case, it's still limited by the single core performance, but the graph will shows more than one core is working (but not to 100%).

In most CPU single core performance limiting cases, you normally can see something like this. A process that demanding something a bit more than 100%. However, this is also not 100% accurate as well.

It was usually between 25 - 70% during view movement, jumped to 94% at one point.

screen-shot-2017-01-10-at-9-04-00-pm-2-jpg.682938
 

Attachments

  • Screen Shot 2017-01-10 at 9.04.00 PM 2.jpg
    1.7 MB · Views: 447
It was usually between 25 - 70% during view movement, jumped to 94% at one point.

screen-shot-2017-01-10-at-9-04-00-pm-2-jpg.682938

TBH, in this case, it doesn't looks like CPU limiting. But you better double check with OpenGL driver monitor.

I just use a well known CPU single core performance limiting OpenGL software - CineBench to make a screenshot.

The CPU usage stay at around 100% all the time.
Screen Shot 2017-01-11 at 13.19.55 copy.jpg
 
  • Like
Reactions: kartcrg
Alright I found OpenGL Driver Monitor and followed Asgoraths instructions. I was constantly navigating the veiwport for that middle section. Does this mean its a CPU limitation?

screen-shot-2017-01-10-at-9-40-22-pm-jpg.682946
 

Attachments

  • Screen Shot 2017-01-10 at 9.40.22 PM.jpg
    2.2 MB · Views: 377
Alright I found OpenGL Driver Monitor and followed Asgoraths instructions. I was constantly navigating the veiwport for that middle section. Does this mean its a CPU limitation?

screen-shot-2017-01-10-at-9-40-22-pm-jpg.682946

From activity monitor, I will say that's not CPU limiting, but something else.

For OpenGL Driver monitor. Device Utilisation % is the function that to show your GPU's utilisation rate.
Screen Shot 2017-01-11 at 13.51.04.jpg


I am not familiar with CAD, but apart from CPU and GPU, is there any other limiting factor? RAM? SSD? Or even software setting within CAD?
 
Last edited:
  • Like
Reactions: kartcrg
From activity monitor, I will say that's not CPU limiting, but something else.

For OpenGL Driver monitor. Device Utilisation % is the function that to show your GPU's utilisation rate.

I am not familiar with CAD, but apart from CPU and GPU, is there any other limiting factor? RAM? SSD? Or even software setting within CAD?

Thank you so much for your time and help here mate, I appreciate it!

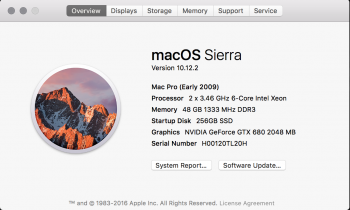
Here's my spec's. Also am running off an SSD but its just plugged in under the superdrive, so not PCIe.
screen-shot-2017-01-10-at-10-07-40-pm-png.682950


Here's the device utilization during viewport nav:
screen-shot-2017-01-10-at-10-05-29-pm-jpg.682949


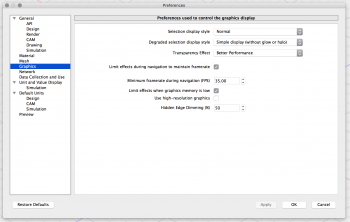
Settings in the App are as fast as possible.. not limiting effects or using high res both make the framerate suck.
screen-shot-2017-01-10-at-10-11-59-pm-png.682953
 

Attachments

  • Screen Shot 2017-01-10 at 10.05.29 PM.jpg
    2.4 MB · Views: 381
  • Screen Shot 2017-01-10 at 10.07.40 PM.png
    Screen Shot 2017-01-10 at 10.07.40 PM.png
    294.5 KB · Views: 338
  • Screen Shot 2017-01-10 at 10.11.59 PM.png
    Screen Shot 2017-01-10 at 10.11.59 PM.png
    229.1 KB · Views: 400
Thank you so much for your time and help here mate, I appreciate it!

Here's my spec's. Also am running off an SSD but its just plugged in under the superdrive, so not PCIe.
screen-shot-2017-01-10-at-10-07-40-pm-png.682950


Here's the device utilization during viewport nav:
screen-shot-2017-01-10-at-10-05-29-pm-jpg.682949


Settings in the App are as fast as possible.. not limiting effects or using high res both make the framerate suck.
screen-shot-2017-01-10-at-10-11-59-pm-png.682953

Is it a 2GB GTX680? Can you check the VRAM usage as well?

So far, my understanding is that's not CPU limiting, and not GPU limiting. However, still possible VRAM limiting. Especially if you turn on high-res or effects will cause a significant performance drop.

If CPU limiting, usually you won't see any difference by reducing resolution or effects.

And since the GPU itself is not at 100% as well. I will guess it's something graphic card related but not the GPU. So, the next suspect is the VRAM.
 
  • Like
Reactions: kartcrg
Register on MacRumors! This sidebar will go away, and you'll see fewer ads.