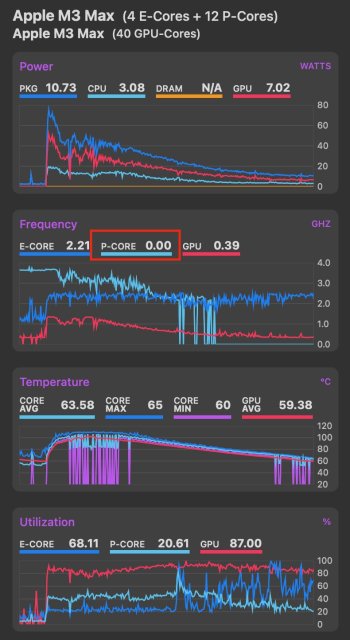
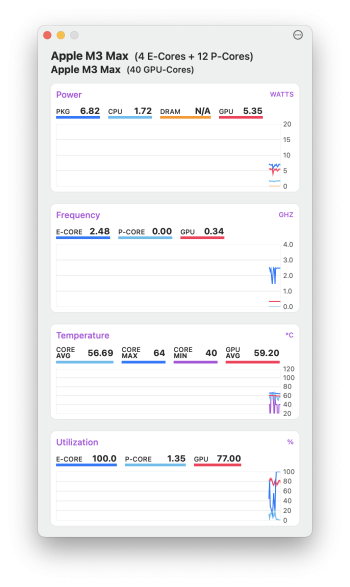
The silicon Macs do not just distribute processes across all cores, or do they necessarily distribute processes to the P cores first, as some might think. Howard Oakley has done several excellent articles about this on his web site The Eclectic Light Company. But in short, what's different with the Apple Silicon Macs is the use of QoS for scheduling processes to cores, E or P.
Now, MacOS offers four directly specified levels of task prioritization—from low to high, they are background, utility, userInitiated, and userInteractive. There's also a fifth level (the default, when no QoS level is manually specified) which allows macOS to decide for itself how important a task is.
On Apple silicon, even if the system is entirely idle, background priority tasks run exclusively on the efficiency/low-power E cores, leaving the higher-performance P cores idle. So in short, it's entirely possible you had either background or MacOS determined low QoS that it was running on the E cores to save the P cores for more intensive work.
If you read Howard's stuff, you may conclude that there is an engineering design plan with Apple Silicon that is different than "traditional" thought - traditional thought *may* be to just get the next process done as fast as possible, so to be ready for future work. This is not what happens with QoS on Apple silicon; the plan is to "manage" the cores so that a larger, more complex app with multiple cores gets fully completed the quickest - instead of worrying about just getting this next process done quickly.
Here are some good starter articles on Howard's stuff, on QoS and what's going on. He's excellent!
https://eclecticlight.co/2021/05/17/how-m1-macs-feel-faster-than-intel-models-its-about-qos/
How the M1’s asymmetric cores can run background tasks more efficiently, or deliver high performance, according to Quality of Service.

eclecticlight.co
EDIT/PS - I forgot to mention per your graphs, he will mention that because of all this, a micro view of a given process may show it actually running worse than on an old Intel Mac - again because priority is to the overall work of the computer, not each and every process as it comes in. At least that;s how I read it (and I am not an expert!)


