Greetings,
I am running the latest update of El Capitan (on a 500 GB SSD) on a Mac Mini Late 2009 with 8 GB RAM. El Cap is the end of the line for this machine.
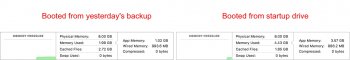
When I boot from yesterday morning's backup of my startup disk, at bootup the App Memory number in Activity Monitor is 1.02 GB with no apps open (other than startup things like Carbon Copy Cleaner and Memory Cleaner, which I only use for its display). However, today when I boot from the startup disk itself, the App Memory number is 3.57 GB.
When I look at the Memory list in Activity Monitor (sorted by amount used, descending), I don't see any apps using huge amounts. But i do notice a lot of smaller-footprint processes that are suddenly using many times more RAM than they used yesterday. A few examples:
I didn't go through the entire list to see if the numbers added up to the increase I'm seeing, but I'm guessing that they do.
I have rebooted from each drive multiple times to verify this behavior. I have booted the startup disk into Safe Mode twice. I have also zapped the PRAM multiple times in a row. No change.
What could possibly be causing this? There are only two things I can think of that I've done since the previous backup:
Bought and connected a Logitech C270 webcam: My computer wouldn't recognize it. The box says "Mac FaceTime" right on the front, but the Logitech web site says it's Windows only. After much Googling, I found out about the Logitech Camera Settings app available from the App Store. I downloaded and ran it, and it told me it needed to run in the background for the camera to work correctly. I clicked OK, and all was well. Just now I ran it again and disabled running in background. Also deleted the app and restarted. This had virtually no effect on the numbers in Activity Monitor.
Played around with Dictation and Text to Speech: Dictation is a known RAM hog. I opted for the Enhanced Dictation, which downloads a 1.22 GB language recognition file and uses that rather than sending your speech to Apple's servers. When I was through playing with this, I switched it off in System Preferences. Could there still be a ghost of this process causing processes like the ones I listed above to swell in their RAM usage?
Attached are dumps of the Activity Monitor data (with my real account name changed to "[my real name]", and a couple of screenshots.
Any thoughts on this would be much appreciated.
Thanks!
DM
I am running the latest update of El Capitan (on a 500 GB SSD) on a Mac Mini Late 2009 with 8 GB RAM. El Cap is the end of the line for this machine.
When I boot from yesterday morning's backup of my startup disk, at bootup the App Memory number in Activity Monitor is 1.02 GB with no apps open (other than startup things like Carbon Copy Cleaner and Memory Cleaner, which I only use for its display). However, today when I boot from the startup disk itself, the App Memory number is 3.57 GB.
When I look at the Memory list in Activity Monitor (sorted by amount used, descending), I don't see any apps using huge amounts. But i do notice a lot of smaller-footprint processes that are suddenly using many times more RAM than they used yesterday. A few examples:
- CalendarAgent went from 16.3 MB to 51.5 MB
- Spotlight from 15.4 to 47.2
- Finder from 13.4 to 43.5
- CalNCService from 10.6 to 42.7
- suggestd from 7.1 to 40.6
I didn't go through the entire list to see if the numbers added up to the increase I'm seeing, but I'm guessing that they do.
I have rebooted from each drive multiple times to verify this behavior. I have booted the startup disk into Safe Mode twice. I have also zapped the PRAM multiple times in a row. No change.
What could possibly be causing this? There are only two things I can think of that I've done since the previous backup:
Bought and connected a Logitech C270 webcam: My computer wouldn't recognize it. The box says "Mac FaceTime" right on the front, but the Logitech web site says it's Windows only. After much Googling, I found out about the Logitech Camera Settings app available from the App Store. I downloaded and ran it, and it told me it needed to run in the background for the camera to work correctly. I clicked OK, and all was well. Just now I ran it again and disabled running in background. Also deleted the app and restarted. This had virtually no effect on the numbers in Activity Monitor.
Played around with Dictation and Text to Speech: Dictation is a known RAM hog. I opted for the Enhanced Dictation, which downloads a 1.22 GB language recognition file and uses that rather than sending your speech to Apple's servers. When I was through playing with this, I switched it off in System Preferences. Could there still be a ghost of this process causing processes like the ones I listed above to swell in their RAM usage?
Attached are dumps of the Activity Monitor data (with my real account name changed to "[my real name]", and a couple of screenshots.
Any thoughts on this would be much appreciated.
Thanks!
DM
")