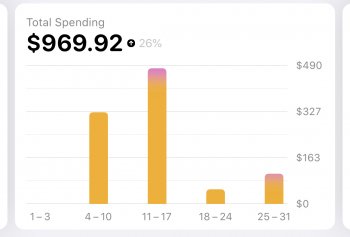
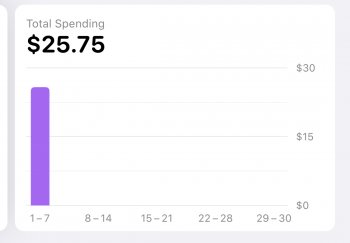
So in the Wallet app, one can view his or her monthly or weekly spending activity.
In the month view, there are pages that prominently display a bar chart of that month's total spending. The scale of the Y-Axis on these charts is variable, and automatically adjusts based on the maximum one spent in any given week throughout the month. This is very strange to me. It defeats the whole purpose of using bar charts for easy month-to-month visual comparison.
The charts are not lying, but if, in one month I spend $500, and then in the next spend $1500, the height of the highest bars in each separate month view will be the same. The surrounding weeks within each month view chart are still, of course, proportional to each other, but the overall height of each bar cannot be compared across months.
While the app is not lying to you, I feel that it is tricking your intuition. The numbers are all correct, it's just that the data visualization aspect is somewhat misleading and therefore inadequate. Certainly, these bar charts should all be scaled based on one's credit limit, right? Look at these attachments, and you'll understand the issue.


