Become a MacRumors Supporter for $50/year with no ads, ability to filter front page stories, and private forums.

jamesr94

macrumors newbie
Original poster
Mar 22, 2017
7
0
Hi there,

I have a late 2012, 27 inch iMac, with a 3TB fusion drive and 32GB of RAM. I'm only using around 650GB of my Hard Drive's storage and rarely, if ever, push the limits of my RAM. I also keep my files fairly organised and regularly scan for viruses and malware. I should also note that even though my computer is nearly 6 years old, the hard drive was replaced with a fresh one last June (2017) so only has a year or so of wear on it.

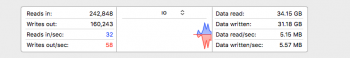
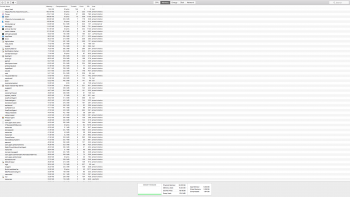
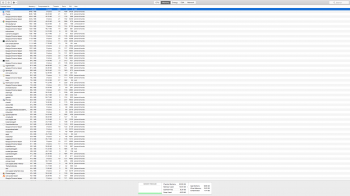
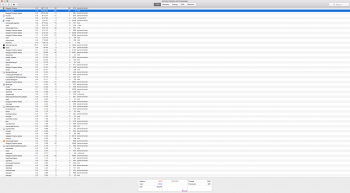
My Finder has been incredibly buggy lately and after trying multiple commonly recommended trouble-shoots, I am yet to solve the problem. As such, I've been looking in Activity Monitor and it seems as though my computer is using an inordinately high amount of RAM considering all that is open right now is Chrome, Finder, iTunes, and Activity Monitor itself.

I have posted screenshots of Activity Monitor's varying tabs - for a computer of the above spec, is this normal ram usage? Or is it using too much?

Thanks for any help/advice!

James : )

UPDATE:

I've just finished re-configuring my system after conducting a clean install, and everything *seems* to be running smoothly, although. I have noticed that when iTunes and Finder use a big chunk of RAM during a task - it slowly goes back down afterwards, which did not happen before.

I also think I found the culprit of the problem - I just tried to install a program called JDownloader, which is useful for grabbing files from youtube, Soundcloud etc. and the Finder IMMEDIATELY shot up to 1.4GB and crashed. The moment I uninstalled it and deleted all traces of it, the Finder began operating normally again.

Thank you to everyone who offered their help and advice : )

UPDATE AGAIN:

The moment I posted this, the problem started all over again.... no idea
 

Attachments

  • Screen Shot 2018-08-12 at 03.45.17.png
    Screen Shot 2018-08-12 at 03.45.17.png
    520.1 KB · Views: 410
  • Screen Shot 2018-08-12 at 03.45.09.png
    Screen Shot 2018-08-12 at 03.45.09.png
    410.2 KB · Views: 266
Last edited:

ApolloBoy

macrumors 6502a
Apr 16, 2015
778
305
San Jose, CA
How many tabs do you usually have open in Chrome? Chrome eats up memory like nothing else so if you have a bunch of tabs open it'll take a hit on your RAM usage.
 

hobowankenobi

macrumors 68020
Aug 27, 2015
2,102
907
on the land line mr. smith.
Seems a bit high, but all that really matters is swap space, and that is low, which is good. Zero is ideal.


Odds are RaM (or lack thereof) is not the cause of the slowdown. Even with a new(er) hard drive, I would suspect that first. You might want to benchmark your drive and see what kind of read/write speeds you get. Keep in mind that HDs slow down as they fill, so Keep it down around 50-60% full for best performance. Never go above about 80% full, or things tend to really crawl.
 

jamesr94

macrumors newbie
Original poster
Mar 22, 2017
7
0
How many tabs do you usually have open in Chrome? Chrome eats up memory like nothing else so if you have a bunch of tabs open it'll take a hit on your RAM usage.
At the time of posting, I would have had around 6 or 7 open. I will try keeping them down to as few as possible.
[doublepost=1534085146][/doublepost]
Seems a bit high, but all that really matters is swap space, and that is low, which is good. Zero is ideal.


Odds are RaM (or lack thereof) is not the cause of the slowdown. Even with a new(er) hard drive, I would suspect that first. You might want to benchmark your drive and see what kind of read/write speeds you get. Keep in mind that HDs slow down as they fill, so Keep it down around 50-60% full for best performance. Never go above about 80% full, or things tend to really crawl.


What is a good read and write speed? This is what it currently says, in Activity Monitor
 

Attachments

  • Screen Shot 2018-08-12 at 15.45.29.png
    Screen Shot 2018-08-12 at 15.45.29.png
    24 KB · Views: 226

jamesr94

macrumors newbie
Original poster
Mar 22, 2017
7
0
STOP using Chrome. It's a resource hog.
Use something else.
Do that, and things will improve.

I know my iMac *isn't* a supercomputer - but should chrome really have such an effect on a computer with 32GB of RAM and a HD that is only 25% full? Or do these things mean nothing? (As you can see, my technical knowledge is limited lol)
 

hobowankenobi

macrumors 68020
Aug 27, 2015
2,102
907
on the land line mr. smith.
At the time of posting, I would have had around 6 or 7 open. I will try keeping them down to as few as possible.
[doublepost=1534085146][/doublepost]


What is a good read and write speed? This is what it currently says, in Activity Monitor

Those numbers seem pretty low
. Depends on what the machine was do specifically, but those are low speeds. A modern HD maxes out at about 150 MB/Sec., while SSD could be 500 or more. You might consider a bench mark tool to make an even comparison.

Yes, chrome is a hog, but I run it on several old Macs with 16GB or 8GB with no issues. Should not be that slow, nor eat that much CPU or RAM. Not normal.
 

ApfelKuchen

macrumors 601
Aug 28, 2012
4,335
3,012
Between the coasts
You have a lot of items in RAM simply because you have enough RAM to hold it all. macOS doesn't flush stuff out of RAM until it needs space for more stuff. Then it looks for the stuff that hasn't been used in the longest while and flushes it.

The OS keeps this stuff in RAM just in case it's needed again - the system runs faster when it doesn't have to re-fetch the same data or code from the slower HD (even a full-fledged SSD is slower than RAM).

Look at the Memory Pressure graph - it's beautiful - low, and green, the way I'd expect it to be on a machine being used the way you say you use it. Memory Pressure is designed to show when RAM is actually insufficient, rather than just filled with temporarily unused stuff.

Similar with CPU - the CPU graph shows 95.21% idle. Again, a long list of loaded processes doesn't tell us much. The question is whether they're making the CPU work hard. They're not. If you look at the list and you have one or two processes at the top of the list using between 90% and 110% of CPU (yes, it can actually go over 100%), then those are your culprits. Maybe it's just a one-time thing - even good apps are capable of misbehaving under rare conditions, but if you keep seeing the same culprits pulling high percentages, then you have a smoking gun.

I happen to have a late 2013 iMac with 3 TB Fusion Drive, and 16 GB RAM. It simply flies. I suspect that, whatever is going on with Finder, it's not due to either CPU or RAM. You've said you've done some troubleshooting stuff... just what have you done? Have you booted to Safe Mode to see if the situation can be duplicated? If not, then you likely have some housecleaning to do among your startup items, kexts, and the like. If the situation continues in Safe Mode, have you created a new Administrative User account and tested to see if the situation repeats when you use that account? If it doesn't, then there's likely some bad user data of some sort (maybe preference files - plists). If it continues in both Safe Mode and a new User account, have you considered reinstalling macOS?

If you haven't taken the time to read the Help documentation for Activity Monitor, I suggest you do. It's a great tool, and the more you know about what it's showing you, the more useful it becomes.
 
  • Like
Reactions: hobowankenobi

jamesr94

macrumors newbie
Original poster
Mar 22, 2017
7
0
Those numbers seem pretty low. Depends on what the machine was do specifically, but those are low speeds. A modern HD maxes out at about 150 MB/Sec., while SSD could be 500 or more. You might consider a bench mark tool to make an even comparison.

Yes, chrome is a hog, but I run it on several old Macs with 16GB or 8GB with no issues. Should not be that slow, nor eat that much CPU or RAM. Not normal.

Hi again,

Thanks for getting back to me. So is a higher read/write speed better than a low one?

And I have uninstalled Chrome all together and switched to Safari, and if anything, Safari seems to be using more ram than chrome did. I have noticed that programs, once they start, the longer I use them, the more ram they take up and when I stop the intensive work or minimise them - this ram is not redistributed.

Yesterday, as a test, I was moving some big files and folders around in Finder and its ram usage went all the way up to 1.4GB and did not go down once I had finished.

iTunes also seems to operate using inordinately high ram, at anywhere from 350-700 MB.

I think I might have a memory leak issue, do you know how I might solve this?

Kind Regards,
James
[doublepost=1534154909][/doublepost]
You have a lot of items in RAM simply because you have enough RAM to hold it all. macOS doesn't flush stuff out of RAM until it needs space for more stuff. Then it looks for the stuff that hasn't been used in the longest while and flushes it.

The OS keeps this stuff in RAM just in case it's needed again - the system runs faster when it doesn't have to re-fetch the same data or code from the slower HD (even a full-fledged SSD is slower than RAM).

Look at the Memory Pressure graph - it's beautiful - low, and green, the way I'd expect it to be on a machine being used the way you say you use it. Memory Pressure is designed to show when RAM is actually insufficient, rather than just filled with temporarily unused stuff.

Similar with CPU - the CPU graph shows 95.21% idle. Again, a long list of loaded processes doesn't tell us much. The question is whether they're making the CPU work hard. They're not. If you look at the list and you have one or two processes at the top of the list using between 90% and 110% of CPU (yes, it can actually go over 100%), then those are your culprits. Maybe it's just a one-time thing - even good apps are capable of misbehaving under rare conditions, but if you keep seeing the same culprits pulling high percentages, then you have a smoking gun.

I happen to have a late 2013 iMac with 3 TB Fusion Drive, and 16 GB RAM. It simply flies. I suspect that, whatever is going on with Finder, it's not due to either CPU or RAM. You've said you've done some troubleshooting stuff... just what have you done? Have you booted to Safe Mode to see if the situation can be duplicated? If not, then you likely have some housecleaning to do among your startup items, kexts, and the like. If the situation continues in Safe Mode, have you created a new Administrative User account and tested to see if the situation repeats when you use that account? If it doesn't, then there's likely some bad user data of some sort (maybe preference files - plists). If it continues in both Safe Mode and a new User account, have you considered reinstalling macOS?

If you haven't taken the time to read the Help documentation for Activity Monitor, I suggest you do. It's a great tool, and the more you know about what it's showing you, the more useful it becomes.

Hi there,

That makes a lot of sense - as you can see, my technical knowledge is rather limited. Even the items that are taking up a lot of memory don't seem to be taking up that much of the CPU's time - whenever I check CPU usage, the Activity Monitor itself always seem to be the highest user.

That being said, I would not be worried if I wasn't encountering performance issues as well. Most of my apps and programs are performing fine - but Finder has been a little buggy lately. Whenever I am dealing with large folders - for instance, my Music folder, which is nearly 200GB, it will be slow to scroll, it will freeze, and the interface will be slow to respond to my actions - I will often get a spinning beach ball that won't let me click anything (even the status bar) until a task is complete and sometimes, I will just have to re-launch all together. It just feels like something is not right, as I am not pushing my computer anywhere near its limits.

The trouble shooting techniques I have used are:

1) PRAM Reset
2) I tried doing an SMC reset. 2 or 3 times, but can never tell if it has worked or gone through properly.
3) I did boot in safe mode and then restarted but the problem persisted - I don't know if the problem was existent in safe mode itself tho - but I find that Safe Mode on my Mac is near impossible to use. Its slow, and the screen flickers - is that right?
3) I have done virus scans to check for malware and removed any non-essential programs that I have recently installed.
4) Turned off/deleted any and all cloud/file sharing programs which I had.
5) I have created a new user and done a test run, and the Ram usage figures were the same in that user's activity monitor too - I actually think the second user pushed the figures up further.

I haven't yet done a clean install, but if it is the only option, I will, of course have to do it. I would rather upgrade to OS High Sierra before I try that though - is that likely to solve anything, or should I just do the clean install?

Thank you for taking the time to reply.

Kind Regards,
James

Note: I have attached my current CPU figures. Should there be so much data in the cached files section? (idk if its important that I just finished a full system virus scan)
 

Attachments

  • Screen Shot 2018-08-13 at 11.06.59.png
    Screen Shot 2018-08-13 at 11.06.59.png
    499.1 KB · Views: 210

MSastre

macrumors 6502a
Aug 18, 2014
614
278
You might want to run Etrecheck to see what problems are there and help eliminate any. EtrCheck is a very well trusted diagnostic tool that will look at your system and identify problems. First 4 uses are free and it will also let you share a report so others can help you with any problems. Very highly regarded by the Apple Support Communities.
 
Last edited:
Register on MacRumors! This sidebar will go away, and you'll see fewer ads.