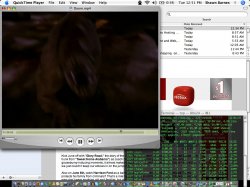
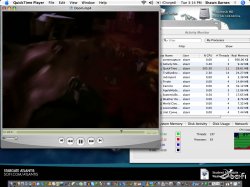
I was watching a movie, Doom, and it came across some parts and slowed down majorly. I ran Terminal and got into top and it showed that my CPU usage was 512% for QuickTime. I did a rewind to the part where it slowed down and was able to take a snapshot for 152%. Why/how does this happen and what is happening???
SCREENSHOT:
SCREENSHOT: