Hello.
I'd appreciate some help on how I should interpret some results I get from Time Profiler and Activity Monitor.
I'm trying to figure out why my game is having regular hiccups on the iPhone 4. I'm trying to run it at 60 FPS, so I know it's tricky on such an old device, but I know some other games manage that fine. I'm using Unity, but this is a more general question about interpreting Instruments results.
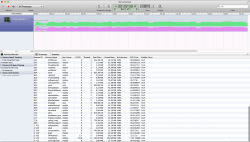
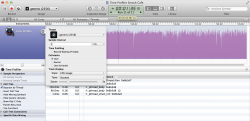
Here is what I get running my game on Time Profiler (I've also made the traces available here in case someone would like to have a closer look):

As far as I understand (but please correct me if I'm wrong), this graph is showing how much CPU my game uses during each sample the Time Profiler takes (I've set the samples to be taken once per millisecond). As you can see, there are frequent downward spikes in that graph, which (based on looking at the game itself as it plays) coincide with the hiccups in the game.
Additionally, the spikes are more common while I touch the device, especially if I move my finger on it continuously (which is what I did while playing our game above). (I couldn't make a comparable non-touching version because my game requires touching, but see below for a comparison.)
What confuses me here is that the spikes are downward: If my code was inefficient, doing too many calculations on some frames, I'd expect to see upward spikes, now downward. So here are the theories I've managed to come up with:
1) The downward spikes represent something else stealing CPU time (like, a background task, or the CPU's speed itself varying, or something). Because less time is available for my processing, I get hiccups, and it also shows as my app using less CPU.
2) My code is in fact inefficient, causing spikes every now and then. Because the processing takes isn't finished in one frame, it continues onto the next, but only needs a little extra time. That means that on that second frame, it uses less CPU, resulting in a downward spike. (It is my understanding that iOS frames are always equal legnth, say, 1/60 s, and so the third frame cannot start early even if we spent just a little extra time on the second.)
3) This is just a sampling problem, caused by the fact that the sampling frequency is 1ms while the frame length is about 16ms.
Both theories would make sense to me, and would also explain why our game has hiccups but some lighter games don't. 1) Lighter games would not suffer so badly from CPU stolen, because they don't need that much CPU to begin with. 2) Lighter games don't have as many spikes of their own.
However, some other tests seem to go against each of these theories:
1) If frames always get stolen like this, I'd expect similar spikes to appear on other games too. However, testing with another game (from the App Store, also using Unity), I get this result:

Note: This game has lots of hiccups while running in the Time Profiler as well, so hiccups don't seem to always mean downward spikes.
As for processes that might be stealing those frames, here is a screenshot of the Activity Monitor:


Do you notice anything that shouldn't be there (smashcafe is my app)? I don't really know what most of these are for.
2) To test the hypothesis that my app is simply spiking, I wrote a program (again in Unity) that wastes a consistent amount of milliseconds per frame (by running a loop until the specified time has passed according to the system clock). Here's what I get on Time Profiler when I make it waste 8ms per frame:

As you can see, the downward spikes are still there, even though the app really shouldn't be able to cause spikes. (You can also see the effect of touching here, as I didn't touch it for the first half of the visible graph, and touched it continuously for the second.)
3) If this was due to unsync between the framerate and the sampling, I'd expect there to be a lot more oscillation there. Surely, my app would use 100% of the milliseconds until it's done with a frame, then drop to zero?
So I'm pretty confused about what to make of this. I'd appreciate any insight you can provide into this, and if you can tell me how to fix it, all the better!
Best regards,
Tommi Horttana
I'd appreciate some help on how I should interpret some results I get from Time Profiler and Activity Monitor.
I'm trying to figure out why my game is having regular hiccups on the iPhone 4. I'm trying to run it at 60 FPS, so I know it's tricky on such an old device, but I know some other games manage that fine. I'm using Unity, but this is a more general question about interpreting Instruments results.
Here is what I get running my game on Time Profiler (I've also made the traces available here in case someone would like to have a closer look):
As far as I understand (but please correct me if I'm wrong), this graph is showing how much CPU my game uses during each sample the Time Profiler takes (I've set the samples to be taken once per millisecond). As you can see, there are frequent downward spikes in that graph, which (based on looking at the game itself as it plays) coincide with the hiccups in the game.
Additionally, the spikes are more common while I touch the device, especially if I move my finger on it continuously (which is what I did while playing our game above). (I couldn't make a comparable non-touching version because my game requires touching, but see below for a comparison.)
What confuses me here is that the spikes are downward: If my code was inefficient, doing too many calculations on some frames, I'd expect to see upward spikes, now downward. So here are the theories I've managed to come up with:
1) The downward spikes represent something else stealing CPU time (like, a background task, or the CPU's speed itself varying, or something). Because less time is available for my processing, I get hiccups, and it also shows as my app using less CPU.
2) My code is in fact inefficient, causing spikes every now and then. Because the processing takes isn't finished in one frame, it continues onto the next, but only needs a little extra time. That means that on that second frame, it uses less CPU, resulting in a downward spike. (It is my understanding that iOS frames are always equal legnth, say, 1/60 s, and so the third frame cannot start early even if we spent just a little extra time on the second.)
3) This is just a sampling problem, caused by the fact that the sampling frequency is 1ms while the frame length is about 16ms.
Both theories would make sense to me, and would also explain why our game has hiccups but some lighter games don't. 1) Lighter games would not suffer so badly from CPU stolen, because they don't need that much CPU to begin with. 2) Lighter games don't have as many spikes of their own.
However, some other tests seem to go against each of these theories:
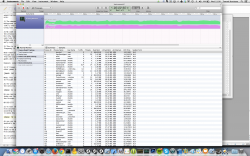
1) If frames always get stolen like this, I'd expect similar spikes to appear on other games too. However, testing with another game (from the App Store, also using Unity), I get this result:
Note: This game has lots of hiccups while running in the Time Profiler as well, so hiccups don't seem to always mean downward spikes.
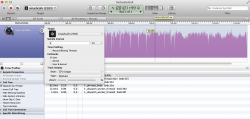
As for processes that might be stealing those frames, here is a screenshot of the Activity Monitor:
Do you notice anything that shouldn't be there (smashcafe is my app)? I don't really know what most of these are for.
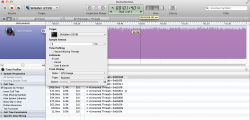
2) To test the hypothesis that my app is simply spiking, I wrote a program (again in Unity) that wastes a consistent amount of milliseconds per frame (by running a loop until the specified time has passed according to the system clock). Here's what I get on Time Profiler when I make it waste 8ms per frame:
As you can see, the downward spikes are still there, even though the app really shouldn't be able to cause spikes. (You can also see the effect of touching here, as I didn't touch it for the first half of the visible graph, and touched it continuously for the second.)
3) If this was due to unsync between the framerate and the sampling, I'd expect there to be a lot more oscillation there. Surely, my app would use 100% of the milliseconds until it's done with a frame, then drop to zero?
So I'm pretty confused about what to make of this. I'd appreciate any insight you can provide into this, and if you can tell me how to fix it, all the better!
Best regards,
Tommi Horttana