Become a MacRumors Supporter for $50/year with no ads, ability to filter front page stories, and private forums.

chris4565

macrumors 65816
Original poster
Sep 22, 2018
1,068
500
Hi guys,

I just saw that my memory usage is quite high (even in idle). See picture below:
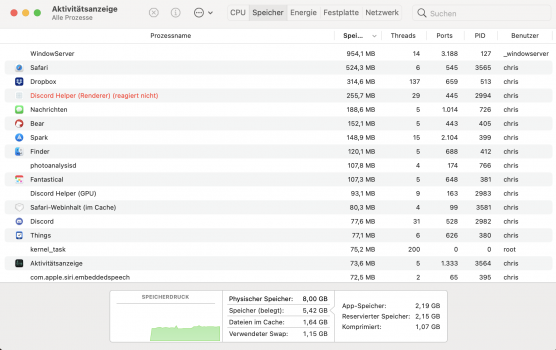
Bildschirmfoto 2020-11-14 um 16.34.30.png
As you can see, especially "WindowServer" takes a lot of RAM. I'm using a 13" 2017 MacBook Pro (8 GB RAM). Is everything normal here?

Thanks in advance
Chris

EDIT: Here's a more realistic image (after using Safari for some time):
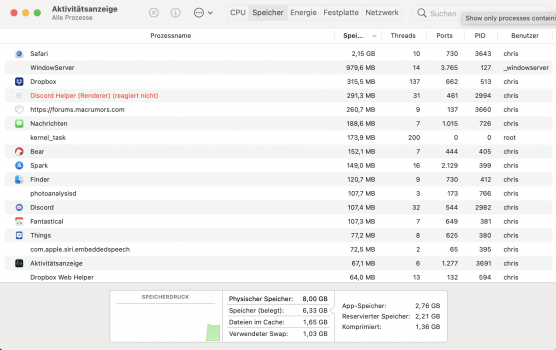
Bildschirmfoto 2020-11-14 um 16.51.13.png
 
Last edited:
Looks like you musty have a bunch of Safari tabs open, but I don't see anything unusual there. Memory pressure is still in the green, so you are in good shape.

It appears that Discord Helper is locked up, so you should look into that.
 
Thanks for the reply. Nope, I just have 1 tab open. By the way, in the meantime, the memory Safari uses crawled up to over 5 GB. I don't know how it was in the past months since I only noticed this now. Maybe Safari is just very resource-hungry.

Regarding the Discord Helper thing: I once made a post on Reddit about this and basically got the answer: "Yup, this is just buggy :confused:". A re-install also didn't help.
 
Doesn't seem so. The memory usage crawls up just browsing the internet.

I think watching YouTube videos uses the most RAM since I got a program memory warning today when I tried to watch an 8K video but after that I completely quit Safari and re-started it and that's when I noticed that the memory usage slowly grows and grows.

Right now, it uses almost 7 GB:
Bildschirmfoto 2020-11-14 um 17.10.46.png
 
HD videos like that really suck up the resources. When I watch HD YT videos the fans on my 13" MBP start spinning up.
 
Okay, but even before watching the video the memory usage was already at a few GB. So either it's just Safari that's really memory-hungry or something's wrong with my MBP (I hope it's the former ;))
 
I don't think you have anything wrong. As long as you have memory available, Safari will try to keep more and more history cached.
 
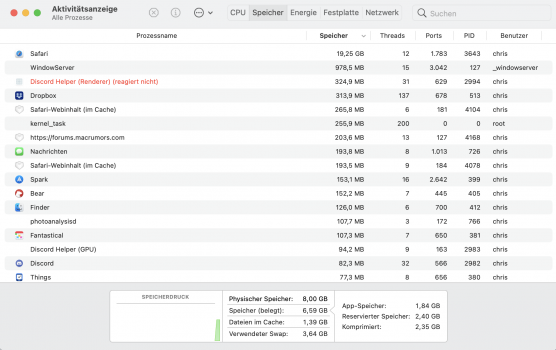
Oh, one more question. In the meantime it looks like this. How is it possible that it says "19.25 GB" at the top while all in all it seems like my MacBook Pro is only using 6.59 GB as indicated at the bottom?
Bildschirmfoto 2020-11-14 um 19.13.18.png
 
At first I thought you were in Windowed view or something (rather than All Processes view). Unless Big Sur has changed things, Safari itself should have a small footprint, and individual sites show their own footprints. And in the first screenshot at least, though not your most recent, that seems to be an accurate count of what Safari is using.

Regarding windowserver, it performs work for all your open apps. If you quit Discord or another one of your apps and see windowserver drop, there you have the culprit for that.

I also see photoanalysisd, Apple's annoying face recognition bloatware, which suggests you might have just set up the Mac?

Rounding back to Safari, I would start off by testing browsing youtube in a New User to get a sense of whether a reinstall is in the cards.
 
I also see photoanalysisd, Apple's annoying face recognition bloatware, which suggests you might have just set up the Mac?
No, I set it up years ago. But I downloaded Big Sur yesterday.
Rounding back to Safari, I would start off by testing browsing youtube in a New User to get a sense of whether a reinstall is in the cards.
It's not just when I'm browsing YouTube that the memory usage goes up. It also goes up when I surf on other sites.
 
Right, you could use any memory-heavy site you want as a benchmark.

If the test User doesn't have this behavior, you might just need to clear cache and cookies (i.e. Reset History) in Safari in your main. Or it might be something harder to track down.

If the test User does have this behavior, you can try a reinstall if you want or wait for others who are on Big Sur to chime in with their Safari footprint.
 
  • Like
Reactions: chris4565
Ok, here's what I found out. I THINK that the issue is the extension 1Blocker. Here was my test procedure.

One note beforehand: To monitor the RAM usage I used iStat Menus. iStat Menus always gives me a way higher Safari memory usage compared to the Safari entry in the activity monitor. I think this is because iStat Menus shows multiple Safari entries combined (e. g. there are also entries called "Safari web content (in cache)" in the activity monitor).

1.) Completely quit Safari
2.) Launch Safari, watch heavy 4K/60 clip
3. [See Safari memory usage with iStat Menus]
4.) Go on some websites
5.) [See Safari memory usage]
6.) Quit Safari (but NOT completely, so just click the red X)
7.) [See Safari memory usage]

WITH 1Blocker X, after the video the usage was at around 2 GB, climbed to 2.5 while surfing on some websites and now the very interesting part: When I quit Safari with the red X the usage stayed about the same BUT: In the activity monitor Safari was listed with hundreds of MB (<-- I will come back to this fact later).

WITHOUT 1Blocker X, after the video the usage was at around 1 - 1.5 GB and stayed there while surfing on some websites and when I quit Safari with the red X the Safari entry itself showed just a usage of around 160 MB (+ some "Safari web content (in cache)" entries with a few hundred MB each.

So it seems like with 1Blocker the used RAM doesn't get freed somehow.
 
Here's an update: I contacted 1Blocker support and got a helpful answer. Here are a few notes:

- The support confirms that there's a memory leak in the current version of Safari but it is not clear yet if it is caused by 1Blocker or the browser itself.
- They are investigating the issue right now and will fix it asap once they figure out why it happens

And great news: I have been told me that disabling the 1Blocker Button extension in Safari > Preferences > Extensions fixes the problem. And from some short testing I can indeed say that this fixes the issue for me. Content still gets blocked, just the 1Blocker button is missing.

I hope this helps others who also have this issue.

Have a great day everyone.
 
Another update: The 1Blocker team just released an update to fix the memory leak issue by reverting back to the blue 1Blocker button in Safari as a temporary workaround. Apparently, the monochrome one caused the issues.
 
  • Like
Reactions: Quackers
Register on MacRumors! This sidebar will go away, and you'll see fewer ads.