Become a MacRumors Supporter for $50/year with no ads, ability to filter front page stories, and private forums.

rastriffler

macrumors newbie
Original poster
Aug 8, 2008
23
0
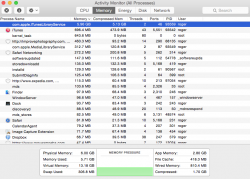
Running Yosemite (10.10.1) on an early 2008 24-inch iMac with 6GB memory. When I run iTunes (12.0.0.140) the machine gradually slows down. Activity monitor shows iTunesLibraryService steadily growing, frequently consuming over 3GB of memory.

Seems like there is some kind of memory leak. Closing iTunes resets the process, but it steadily climbs back up as music is played. Never had this problem on any other versions of the OS or iTunes.

Anyone else seeing this? Any thoughts?

Thanks!
 

rastriffler

macrumors newbie
Original poster
Aug 8, 2008
23
0
Not getting any better...

The itunesLibraryService process continues to hog memory - you can see in the attached screenshot that it's over 5GB now. Granted, the memory is compressed, but it seems like this is pretty clearly a leak.

Anyone else seeing this?
Thanks!

Roger
 

Attachments

  • Screen Shot 2015-01-13 at 10.42.33 AM.png
    Screen Shot 2015-01-13 at 10.42.33 AM.png
    154 KB · Views: 108

GGJstudios

macrumors Westmere
May 16, 2008
44,556
950
The itunesLibraryService process continues to hog memory - you can see in the attached screenshot that it's over 5GB now. Granted, the memory is compressed, but it seems like this is pretty clearly a leak.
Unless you see your memory pressure graph turn from green to amber or red, or you experience other symptoms like beachballs or slow performance, I wouldn't worry about it.

It is quite normal for all of your memory to be in use by OS X. It does not mean that you are running out of memory or that it is maxed out. OS X will manage all available memory, making it available to apps on an as-needed basis. Refer to the following Apple support article for more information on how to understand your Activity Monitor readings.
The combination of Free, Wired, Active, Inactive & Used memory statistics in previous versions of Activity Monitor have been replaced in Mavericks with an easy to read "Memory Pressure" graph.
Memory pressure is indicated by color:
  • Green – RAM memory resources are available.
  • Amber – RAM memory resources are being tasked.
  • Red – RAM memory resources are depleted and OS X is using the drive for memory.
 

rastriffler

macrumors newbie
Original poster
Aug 8, 2008
23
0
Thanks, GGJ. I was hoping that something like this was the case, but I was concerned because I never did see the memory being released. But as you say, I've generally maintained a green pressure graph, so perhaps I'm paying too much attention to the activity monitor. Probably also does not help that I have the Memory Clean App displaying remaining free memory numbers in red on my menu bar. ;o)
 
Register on MacRumors! This sidebar will go away, and you'll see fewer ads.