Become a MacRumors Supporter for $50/year with no ads, ability to filter front page stories, and private forums.

serralves

macrumors newbie
Original poster
Apr 28, 2005
27
0
Hi, this might have to go in the software section but I wanted to start where people might have used what I am looking for!

I want to plot values between 0 and 1 that are associated with three parameters - ie values f(p1,p2,p3) and it strikes me that the most visually informative way of presenting this is if I plot the data chromatically and on a triangle whose sides (left to right) represent the values of each of the parameters.

Does anyone know of a mac os x program that would let me do this?

Failing that, is there a name for these types of plots, so that I might look for extensions to MATLAB etc or check feature sets of graphing software? I know it is not a triplot (as available in R), since that marks the position of a point with respect to three variables, rather than assigning values to a dense three value parameter space...
 

MongoTheGeek

macrumors 68040
Hi, this might have to go in the software section but I wanted to start where people might have used what I am looking for!

I want to plot values between 0 and 1 that are associated with three parameters - ie values f(p1,p2,p3) and it strikes me that the most visually informative way of presenting this is if I plot the data chromatically and on a triangle whose sides (left to right) represent the values of each of the parameters.

Does anyone know of a mac os x program that would let me do this?

Failing that, is there a name for these types of plots, so that I might look for extensions to MATLAB etc or check feature sets of graphing software? I know it is not a triplot (as available in R), since that marks the position of a point with respect to three variables, rather than assigning values to a dense three value parameter space...

Take a look at Grapher. Its in the utilities folder. Its icon seems to be what you describe :)
 

Eraserhead

macrumors G4
Nov 3, 2005
10,434
12,250
UK
Take a look at Grapher. Its in the utilities folder. Its icon seems to be what you describe :)

The problem here that he has a function from R^3 --> R (where I'm assuming R is the real numbers (though it could be something else)) which gives a total of 4 dimensions. However Grapher can only plot something in 3 dimensions. Grapher could plot f(x,y), but not f(x,y,z) unless f(x,y,z) happens to be constant, which doesn't appear to be the case here.

Now you can create a four dimensional plot by using a clever trick, like the triangle, if the x,y and z values are bounded (i.e. they don't go off to infinity), or by using colour over the three dimensional plot to show the value of the fourth dimension, though that may not always work.

However I would have thought you can do this in MATLAB or Mathematica, however I have no idea how you might go about it as I've never used Mathematica and the MATLAB graphing system is fairly horrible to use (I mostly use Grapher if I can as its much easier to use ;)).

Mathematica may be better but I don't know if you have a copy of it, but either way it may be better to pose this question on a MATLAB or Mathematica forum. For MATLAB take a look here.
 

lazydog

macrumors 6502a
Sep 3, 2005
709
6
Cramlington, UK
Hi, wouldn't a cube be better?

b e n

Having re-read my post I realise what a useless contribution it was. My apologies!!!

Here's a suggestion though, you could use OpenGL to draw a cube with each voxel coloured according to your function. You could then visualise your data by using clipping planes to look at slices through the cube.

Hope that's a better attempt!

b e n
 

cruzrojas

macrumors member
Mar 26, 2007
67
0
USA
f(p1,p2,p3) and it strikes me that the most visually informative way of presenting this is if I plot the data chromatically and on a triangle whose sides (left to right) represent the values of each of the parameters.

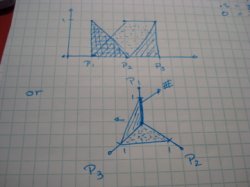
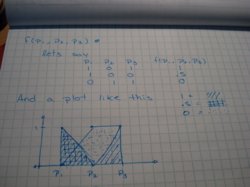
I'm having trouble to understand how you want to do the plot, let me know if any of this two plots resemble a little bit what do you want. for the second one I have done that kind of plots on excell, the first one will not be too hard to do on MATLAB, you just have to write a plotting function and parse the parameters to it.

EDIT: sorry the pictures are the other way around.
 

Attachments

  • DSC00492.jpg
    DSC00492.jpg
    40.5 KB · Views: 160
  • DSC00491.jpg
    DSC00491.jpg
    40.3 KB · Views: 141

mrmma

macrumors member
Dec 27, 2006
60
0
Missouri
Hi, I think what you want is called a ternary plot and is quite common in geology (eg for percentage abundances of 3 different elements in a rock type) It is available under matlab at: http://www.mathworks.com/matlabcentral/fileexchange/loadFile.do?objectId=7210&objectType=file
But I think googling ternary and mac might help here too.
Cheers,
Chris

You beat me to it. I'd recommend SigmaPlot. It's a nice, easy to use interface, that has built in (though I've not used this feature) ternary plot functionality. It is much easier to create a nice looking plot with Sigma Plot than Mathematica or Matlab (I use both).

This link is an example of what it can do: http://www.omatrix.com/spsamples/ternary.html

Edit: Apparently there is no Mac version. Our license is a PC one. Sigh.
 

serralves

macrumors newbie
Original poster
Apr 28, 2005
27
0
Thanks for all your replies.

I've been away from an internet connection for a few days. I think what I originally had in mind when I posted was not actually possible - a 2D array of tessalating hexagons appropriately colour coded, but I will look at the options you have very kindly suggested.

Many thanks,
Matt
 

serralves

macrumors newbie
Original poster
Apr 28, 2005
27
0
Actually, the MATLAB functions were exactly what I was after! These plots are going to look *so* beautiful... I'll try and post some next week, if anyone is interested.
 
Register on MacRumors! This sidebar will go away, and you'll see fewer ads.