Hi there, everyone,
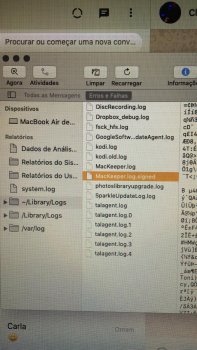
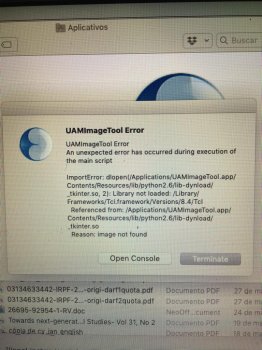
I'm having troubles with opening a software I downloaded. It's called UAM Image Tool, to annotate content. I run the console to see why and many things appeared. Among them, it says there is something related to MacKeeper. I uninstalled it from all over the place, but still, the crash report (below) that seems to be related to Mackeeper. Due to characters' restriction, I edited the report below, but I have attached also the report on the Library Logs and the first message it shows when saying it's not able to run. Can anyone help me with this, please?
Thank you in advance.
Crash Report:
Process: MacKeeper Helper [831]
Path: /Applications/MacKeeper.app/Contents/Resources/MacKeeper Helper.app/Contents/MacOS/MacKeeper Helper
Identifier: com.zeobit.MacKeeper.Helper
Version: 2.31 (822)
Code Type: X86-64 (Native)
Parent Process: ??? [1]
Responsible: MacKeeper Helper [831]
User ID: 501
Crashed Thread: 8 Dispatch queue: com.apple.libnetwork.pacResolution
Exception Type: EXC_BAD_INSTRUCTION (SIGILL)
Exception Codes: 0x0000000000000001, 0x0000000000000000
Exception Note: EXC_CORPSE_NOTIFY
Termination Signal: Illegal instruction: 4
Termination Reason: Namespace SIGNAL, Code 0x4
Terminating Process: exc handler [831]
Application Specific Information:
*** Unable to create timer Port (0) ***
External Modification Summary:
Calls made by other processes targeting this process:
task_for_pid: 1198
thread_create: 0
thread_set_state: 0
Calls made by this process:
task_for_pid: 0
thread_create: 0
thread_set_state: 0
Calls made by all processes on this machine:
task_for_pid: 468732
thread_create: 0
thread_set_state: 0
VM Region Summary:
ReadOnly portion of Libraries: Total=480.5M resident=0K(0%) swapped_out_or_unallocated=480.5M(100%)
Writable regions: Total=1.4G written=0K(0%) resident=0K(0%) swapped_out=0K(0%) unallocated=1.4G(100%)
VIRTUAL REGION
REGION TYPE SIZE COUNT (non-coalesced)
=========== ======= =======
Accelerate framework 256K 3
Activity Tracing 256K 2
CG backing stores 4K 2
CG image 32K 4
CoreGraphics 8K 2
CoreImage 4K 2
CoreUI image data 72K 3
CoreUI image file 360K 6
Dispatch continuations 16.0M 3
Image IO 96K 3
JS JIT generated code 1.0G 4
Kernel Alloc Once 8K 2
MALLOC 355.1M 40
MALLOC guard page 32K 8
Memory Tag 242 12K 2
Memory Tag 251 20K 2
SQLite page cache 64K 2
STACK GUARD 56.0M 11
Stack 12.6M 11
VM_ALLOCATE 80K 8
WebKit Malloc 1144K 5
__DATA 37.3M 329
__FONT_DATA 4K 2
__LINKEDIT 216.8M 10
__TEXT 263.7M 335
__UNICODE 564K 2
mapped file 42.2M 19
shared memory 2936K 17
=========== ======= =======
TOTAL 2.0G 811


