Become a MacRumors Supporter for $50/year with no ads, ability to filter front page stories, and private forums.

thinkingBanana

macrumors newbie
Original poster
Jun 3, 2014
19
10
Hi all,

I have been using the lowest end Mac mini (8GB RAM, 256GB SSD) for two weeks now, and I am pretty happy with it. My workflow doesn't seem to stress the CPU that much, and memory pressure stays in the green zone 95% of the time.

When I start coding and running emulators in Xcode, it does push the system a bit more and start invoking 2GB+ of swap, which doesn't concern me since my system is still smooth and quiet. But after reading post from MacBook-disable-swap about how using SWAP might reduce SSD life span, I decided to download smartmontools to see how much of an impact it really is.

Note that I used the official release of “smartmontools” from 2019-12-30, which is not optimized for Apple M1; however, I do not believe this impacts the reading I am getting, since I also compiled “smartmontools” from source and got the same result.

Code:
 ~/Documents/SSD_WearTest  smartctl -a disk0                                                       ✔  02:48:52 am
smartctl 7.1 2019-12-30 r5022 [Darwin 20.1.0 x86_64] (sf-7.1-1)
Copyright (C) 2002-19, Bruce Allen, Christian Franke, www.smartmontools.org

=== START OF INFORMATION SECTION ===
Model Number:                       APPLE SSD AP0256Q
Serial Number:                      [Hide intentionally]
Firmware Version:                   1161.40.
PCI Vendor/Subsystem ID:            0x106b
IEEE OUI Identifier:                0x000000
Controller ID:                      0
Number of Namespaces:               3
Local Time is:                      Mon Dec  7 02:54:21 2020 PST
Firmware Updates (0x02):            1 Slot
Optional Admin Commands (0x0004):   Frmw_DL
Optional NVM Commands (0x0004):     DS_Mngmt
Maximum Data Transfer Size:         256 Pages

Supported Power States
St Op     Max   Active     Idle   RL RT WL WT  Ent_Lat  Ex_Lat
0 +     0.00W       -        -    0  0  0  0        0       0

=== START OF SMART DATA SECTION ===
SMART overall-health self-assessment test result: PASSED

SMART/Health Information (NVMe Log 0x02)
Critical Warning:                   0x00
Temperature:                        37 Celsius
Available Spare:                    100%
Available Spare Threshold:          99%
Percentage Used:                    0%
Data Units Read:                    10,901,900 [5.58 TB]
Data Units Written:                 9,906,549 [5.07 TB]
Host Read Commands:                 136,713,020
Host Write Commands:                58,768,114
Controller Busy Time:               0
Power Cycles:                       72
Power On Hours:                     52
Unsafe Shutdowns:                   8
Media and Data Integrity Errors:    0
Error Information Log Entries:      0

Read Error Information Log failed: NVMe admin command:0x02/page:0x01 is not supported

As you can see, I have written 5.07TB to my SSD in two weeks, and that’s about 370GB write a day, which seems really high for me. From limited research I have done (just from article1, article2, really), a typical 256 GB SSD should handle 150TB data write officially, and will last around 1024TB+ in a lot of tests. So at my consumption speed, I would start running into SSD issue in 59 Weeks if I am unlucky, or about 10 years if it actually goes into petabyte range.

I wonder if you are seeing similar amount of SSD write with your workflow? Does it look too high for you? Or maybe I am reading the result wrong?

I logged some of my daily measurements if you are interested:
Normal day when it just idle: 30GB~ write
Only use for web browsing: 230GB~ write
Xcode for a few hours with emulator: 1.2TB~ write
 
Last edited:

thinkingBanana

macrumors newbie
Original poster
Jun 3, 2014
19
10
Maybe posting at 6:00 AM is not the best idea; commenting on my own post to bump it up a bit.
 

Gnattu

macrumors 65816
Sep 18, 2020
1,107
1,671
If the write value is that high and the percentage used is still 0%, I think there might be some "unit conversion" problem.

I'm having about 2TB write for one week, and I'm receiving a new one today so I can check out what a "new" one reports.
 
  • Like
Reactions: rui no onna

Gnattu

macrumors 65816
Sep 18, 2020
1,107
1,671
Screen Shot 2020-12-07 at 6.26.29 PM.png

Received my new MBP, and showing 110GB written out of the box, might be something wrong with the readings. Will update when:
1. updated to 11.0.1, measure write difference
2. completion of migration assistant, measure write difference again.
 

thinkingBanana

macrumors newbie
Original poster
Jun 3, 2014
19
10
Received my new MBP, and showing 110GB written out of the box, might be something wrong with the readings. Will update when:
1. updated to 11.0.1, measure write difference
2. completion of migration assistant, measure write difference again.
Thanks!

Yeah it looks pretty high out of the box; maybe factory testing usage?

I am also on 11.0.1, and our result matches in terms of (Data Unit inside the bracket) / (Data Unit outside the bracket). They also matched with the number in this article MacBook-disable-swap.

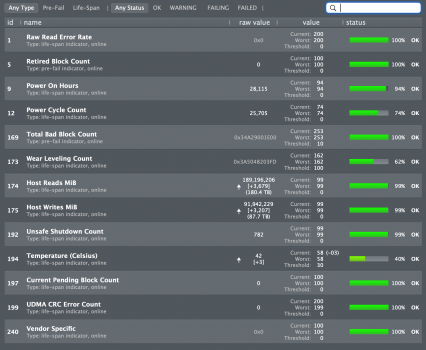
As a reference, my MacBook Pro 15" mid 2014, 512GB shows different type of data output, and I don't know exactly how to interpret it. The best I can find is that it seems like "Wear_Leveling_Count"'s "Value" will reach 100 when the drive starts to have issue, and it starts with 200. So my MacBook Pro still has about 63% of endurance until it starts to show issue. Not bad for a daily driver that is 6 years old.

Code:
~  smartctl -a disk0                                           ✔  07:57:04 PM
smartctl 7.1 2019-12-30 r5022 [Darwin 20.1.0 x86_64] (sf-7.1-1)
Copyright (C) 2002-19, Bruce Allen, Christian Franke, www.smartmontools.org

=== START OF INFORMATION SECTION ===
Model Family:     Apple SD/SM/TS...E/F/G SSDs
Device Model:     APPLE SSD SM0512F
Serial Number:    [Hide on purpose]
LU WWN Device Id: 5 002538 655584d30
Firmware Version: UXM2JA1Q
User Capacity:    500,277,790,720 bytes [500 GB]
Sector Sizes:     512 bytes logical, 4096 bytes physical
Rotation Rate:    Solid State Device
Device is:        In smartctl database [for details use: -P show]
ATA Version is:   ATA8-ACS T13/1699-D revision 4c
SATA Version is:  SATA 3.0, 6.0 Gb/s (current: 6.0 Gb/s)
Local Time is:    Mon Dec  7 19:57:14 2020 PST
SMART support is: Available - device has SMART capability.
SMART support is: Enabled

=== START OF READ SMART DATA SECTION ===
SMART overall-health self-assessment test result: PASSED

General SMART Values:
Offline data collection status:  (0x00)    Offline data collection activity
                    was never started.
                    Auto Offline Data Collection: Disabled.
Self-test execution status:      (   0)    The previous self-test routine completed
                    without error or no self-test has ever
                    been run.
Total time to complete Offline
data collection:         (    0) seconds.
Offline data collection
capabilities:              (0x5f) SMART execute Offline immediate.
                    Auto Offline data collection on/off support.
                    Abort Offline collection upon new
                    command.
                    Offline surface scan supported.
                    Self-test supported.
                    No Conveyance Self-test supported.
                    Selective Self-test supported.
SMART capabilities:            (0x0003)    Saves SMART data before entering
                    power-saving mode.
                    Supports SMART auto save timer.
Error logging capability:        (0x01)    Error logging supported.
                    General Purpose Logging supported.
Short self-test routine
recommended polling time:      (   2) minutes.
Extended self-test routine
recommended polling time:      (  10) minutes.

SMART Attributes Data Structure revision number: 40
Vendor Specific SMART Attributes with Thresholds:
ID# ATTRIBUTE_NAME          FLAG     VALUE WORST THRESH TYPE      UPDATED  WHEN_FAILED RAW_VALUE
  1 Raw_Read_Error_Rate     0x001a   200   200   000    Old_age   Always       -       0
  5 Reallocated_Sector_Ct   0x0033   100   100   000    Pre-fail  Always       -       0
  9 Power_On_Hours          0x0032   094   094   000    Old_age   Always       -       27993
 12 Power_Cycle_Count       0x0032   074   074   000    Old_age   Always       -       25597
169 Unknown_Apple_Attrib    0x0013   253   253   010    Pre-fail  Always       -       3617050336768
173 Wear_Leveling_Count     0x0032   163   163   100    Old_age   Always       -       3998688347128
174 Host_Reads_MiB          0x0022   099   099   000    Old_age   Always       -       188139254
175 Host_Writes_MiB         0x0022   099   099   000    Old_age   Always       -       91138553
192 Power-Off_Retract_Count 0x0012   099   099   000    Old_age   Always       -       774
194 Temperature_Celsius     0x0022   069   069   000    Old_age   Always       -       31 (Min/Max 13/68)
197 Current_Pending_Sector  0x0022   100   100   000    Old_age   Always       -       0
199 UDMA_CRC_Error_Count    0x001a   200   199   000    Old_age   Always       -       0
240 Unknown_SSD_Attribute   0x0022   100   100   000    Old_age   Always       -       0

SMART Error Log Version: 1
No Errors Logged

SMART Self-test log structure revision number 1
No self-tests have been logged.  [To run self-tests, use: smartctl -t]

SMART Selective self-test log data structure revision number 1
 SPAN  MIN_LBA  MAX_LBA  CURRENT_TEST_STATUS
    1        0        0  Not_testing
    2        0        0  Not_testing
    3        0        0  Not_testing
    4        0        0  Not_testing
    5        0        0  Not_testing
Selective self-test flags (0x0):
  After scanning selected spans, do NOT read-scan remainder of disk.
If Selective self-test is pending on power-up, resume after 0 minute delay.

If someone could give a hint on how to make comparison between this old MBP's data and the new Mac mini's data, we could probably better understand how the SSD is doing.
 

rui no onna

Contributor
Oct 25, 2013
14,917
13,261
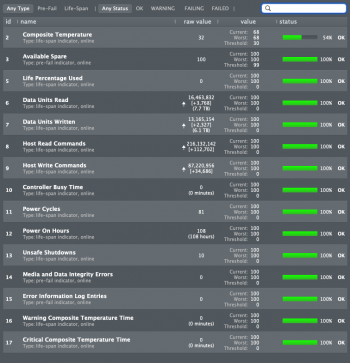
@OldMike thanks for the tool suggestion, I have downloaded DriveDX and ran it, the result is attached.

Looks like the result is identical to smartmontool in terms of block count, but the same block count yields a different TB count. DriveDX reports 6.1TB write, while smartmontool reports 6.7TB write.


Curious, what are the values and raw value for Life Percentage Used under Health Indicators in DriveDX? Perhaps you can post a screenshot of the full Health Indicators screen?

Mind, 6.1 vs 6.7 is pretty much the discrepancy between binary and decimal reporting.
 

rui no onna

Contributor
Oct 25, 2013
14,917
13,261
By the way, here are the results for mine.

Code:
smartctl 7.1 2019-12-30 r5022 [Darwin 20.2.0 x86_64] (sf-7.1-1)
Copyright (C) 2002-19, Bruce Allen, Christian Franke, www.smartmontools.org

=== START OF INFORMATION SECTION ===
Model Number:                       APPLE SSD AP0512Q
Serial Number:                     
Firmware Version:                   1161.60.
PCI Vendor/Subsystem ID:            0x106b
IEEE OUI Identifier:                0x000000
Controller ID:                      0
Number of Namespaces:               3
Local Time is:                      Tue Dec 29 20:58:53 2020 PST
Firmware Updates (0x02):            1 Slot
Optional Admin Commands (0x0004):   Frmw_DL
Optional NVM Commands (0x0004):     DS_Mngmt
Maximum Data Transfer Size:         256 Pages

Supported Power States
St Op     Max   Active     Idle   RL RT WL WT  Ent_Lat  Ex_Lat
 0 +     0.00W       -        -    0  0  0  0        0       0

=== START OF SMART DATA SECTION ===
SMART overall-health self-assessment test result: PASSED

SMART/Health Information (NVMe Log 0x02)
Critical Warning:                   0x00
Temperature:                        28 Celsius
Available Spare:                    100%
Available Spare Threshold:          99%
Percentage Used:                    0%
Data Units Read:                    2,687,078 [1.37 TB]
Data Units Written:                 1,452,647 [743 GB]
Host Read Commands:                 28,227,836
Host Write Commands:                12,887,179
Controller Busy Time:               0
Power Cycles:                       158
Power On Hours:                     12
Unsafe Shutdowns:                   3
Media and Data Integrity Errors:    0
Error Information Log Entries:      0

Read Error Information Log failed: NVMe admin command:0x02/page:0x01 is not supported
 

thinkingBanana

macrumors newbie
Original poster
Jun 3, 2014
19
10
Curious, what are the values and raw value for Life Percentage Used under Health Indicators in DriveDX? Perhaps you can post a screenshot of the full Health Indicators screen?

Mind, 6.1 vs 6.7 is pretty much the discrepancy between binary and decimal reporting.
Thanks for pointing out the reasoning of the difference.

The life percentage is still 100% percent as shown in attached pic.

Although I have to point out that my daily driver 2014 MPB 15" 16GB - 512GB is also 100% under moderate use every day. There used to be a SSD wear count in my older model (old MPB has 62% remaining wear count), but it looks like either nobody has figured out how to read that number on M1 machine yet, or Apple simply removed it.
 

Attachments

  • Live Percentage SSD.png
    Live Percentage SSD.png
    165.7 KB · Views: 383

thinkingBanana

macrumors newbie
Original poster
Jun 3, 2014
19
10
By the way, here are the results for mine.

Code:
smartctl 7.1 2019-12-30 r5022 [Darwin 20.2.0 x86_64] (sf-7.1-1)
Copyright (C) 2002-19, Bruce Allen, Christian Franke, www.smartmontools.org

=== START OF INFORMATION SECTION ===
Model Number:                       APPLE SSD AP0512Q
Serial Number:                    
Firmware Version:                   1161.60.
PCI Vendor/Subsystem ID:            0x106b
IEEE OUI Identifier:                0x000000
Controller ID:                      0
Number of Namespaces:               3
Local Time is:                      Tue Dec 29 20:58:53 2020 PST
Firmware Updates (0x02):            1 Slot
Optional Admin Commands (0x0004):   Frmw_DL
Optional NVM Commands (0x0004):     DS_Mngmt
Maximum Data Transfer Size:         256 Pages

Supported Power States
St Op     Max   Active     Idle   RL RT WL WT  Ent_Lat  Ex_Lat
0 +     0.00W       -        -    0  0  0  0        0       0

=== START OF SMART DATA SECTION ===
SMART overall-health self-assessment test result: PASSED

SMART/Health Information (NVMe Log 0x02)
Critical Warning:                   0x00
Temperature:                        28 Celsius
Available Spare:                    100%
Available Spare Threshold:          99%
Percentage Used:                    0%
Data Units Read:                    2,687,078 [1.37 TB]
Data Units Written:                 1,452,647 [743 GB]
Host Read Commands:                 28,227,836
Host Write Commands:                12,887,179
Controller Busy Time:               0
Power Cycles:                       158
Power On Hours:                     12
Unsafe Shutdowns:                   3
Media and Data Integrity Errors:    0
Error Information Log Entries:      0

Read Error Information Log failed: NVMe admin command:0x02/page:0x01 is not supported
Thanks for the data! Do you mind to share a bit of the following so we can have a clearer picture of the level of write expected?
0. SSD size (Looks like 512GB?)
1. Number of RAM built in
2. How heavy is the workload
3. How long you have been having your computer
 

rui no onna

Contributor
Oct 25, 2013
14,917
13,261
Thanks for pointing out the reasoning of the difference.

The life percentage is still 100% percent as shown in attached pic.

Although I have to point out that my daily driver 2014 MPB 15" 16GB - 512GB is also 100% under moderate use every day. There used to be a SSD wear count in my older model (old MPB has 62% remaining wear count), but it looks like either nobody has figured out how to read that number on M1 machine yet, or Apple simply removed it.

Thanks!

#3 Available Spare and #5 Life Percentage Used seems to be the two attributes to monitor. Going by the #3 threshold, it looks like as soon as it starts to use spare NAND, it's considered bad.

I'd be very interested to see at what level of #7 Host Writes that #5 figure will budge from 100% (and certainly any changes to the raw value as well). That should give us the expected lifespan of the Apple SSD in terms of P/E cycle count and TBW (at least with your given workload).

With 6.7TB writes on 256GB, I would've expected a raw wear leveling count of at least 26 by now so perhaps #7 doesn't report raw WLC but straight up percentage. Assuming a rated P/E cycle count of 3,000 (3D TLC), it should get 1% wear around the 7.68TB mark (256GB x 30 P/E cycles).

And again, this is assuming the host write figures are accurate. The description for #7 Host Writes say it's based on 512 bytes but I've done some calculations and the reported 6.7TB is more like raw value x 512 KB.


Thanks for the data! Do you mind to share a bit of the following so we can have a clearer picture of the level of write expected?
0. SSD size (Looks like 512GB?)
1. Number of RAM built in
2. How heavy is the workload
3. How long you have been having your computer

0. Yep, 512GB

1. 8GB

2. Very light. Just web browsing and online shopping with a smattering of remote desktop.

3. Probably less than 30 hours onscreen time. Iirc, I received it Dec 19 and unboxed and started playing with it Dec 20. I still do like my iPad a lot better for browsing in bed and the couch, and I ended up using a noisy old ThinkPad for telecommuting because the keyboard's just a lot easier to work on for RDP into Windows.

Maybe tomorrow, I'll monitor before and after disk writes for a web browsing session as reported by Activity Monitor, DriveDX and smartmontools and compare the results among the three.
 

thinkingBanana

macrumors newbie
Original poster
Jun 3, 2014
19
10
I'd be very interested to see at what level of #7 Host Writes that #5 figure will budge from 100% (and certainly any changes to the raw value as well). That should give us the expected lifespan of the Apple SSD in terms of P/E cycle count and TBW (at least with your given workload).
Me too, maybe I will stress the machine a bit more before my return window arrives in a week and see if I can get it to report 1% wear. By the way, the attached is my 2014 16GB MBP's number. Looks like Apple changed how the number was reported over the years quite a bit.

For my MBP, #173 Shows 62% cycle remaining, and #175 Shows 87.7TB of data write. If assume the rate of wear is linear, we should have an SSD that will starting to have issue after 230TBW (87.7TB / 0.38), which probably makes sense for an SSD from 2014? At least this TBW + Wear Percentage combination makes more sense to me.
3. Probably less than 30 hours onscreen time. Iirc, I received it Dec 19 and unboxed and started playing with it Dec 20. I still do like my iPad a lot better for browsing in bed and the couch, and I ended up using a noisy old ThinkPad for telecommuting because the keyboard's just a lot easier to work on for RDP into Windows.
This definitely matches my finding as well, browsing web on my M1 Mac Mini here and there gives me around 230GB/day of usage. And @Gnattu reported that out of the box 110GB has already be written to the disk. I will try to reach out to folks who made DriveDx and see what's their opinion on the number reported.
 

Attachments

  • MPB 2014 SSD Wear.png
    MPB 2014 SSD Wear.png
    368.7 KB · Views: 266

snakes-

macrumors 6502
Jul 27, 2011
357
140
This is nothing new and discussed since the first ssd was out years ago.
you can unload a lot more things like described here https://windsketch.cc/macbook-disable-swap/
but disabling swap is not recommended.

I tested it with the app launch control to unload my unwanted tasks like:
spotlight
systemstats
diagnostics
tailsspin
spindump
all the meta things

This reduce even the total ram usage.


i tried it with a script but my scripts don't work :eek:
with fs_usage and different options in terminal you can see what causes diskio activities
 

rui no onna

Contributor
Oct 25, 2013
14,917
13,261
This is nothing new and discussed since the first ssd was out years ago.
you can unload a lot more things like described here https://windsketch.cc/macbook-disable-swap/
but disabling swap is not recommended.

That's at an average of 100 GB per day, though. Probably less if you discount initial setup.

We're talking at least x3 higher wear here assuming DriveDX is doing the conversions accurately. 1.2TB in just a few hours sounds insane to me.

I have pagefile enabled on my Windows desktops and they're left at default optimizations. Running 24/7, those only average 20-50GB writes per day.
 
  • Like
Reactions: thinkingBanana

snakes-

macrumors 6502
Jul 27, 2011
357
140
i give DriveDX a try and will test it for my own.

I have made some fresh install 52 hours ago.
Drivedx numbers host writes 2.7 TB in 51 hours.

i used even the terminal command
iostat -Id disk0
KB/t xfrs MB
25.17 187500 4608.77

(sudo iosnoop) is even fine to monitoring disk activities.
 
Last edited:

thinkingBanana

macrumors newbie
Original poster
Jun 3, 2014
19
10
i tried it with a script but my scripts don't work :eek:
with fs_usage and different options in terminal you can see what causes diskio activities
Thanks for providing more options for checking this type of things.

I am not sure whether having the SWAP file there is enough to elevate the SSD usage. For example, if I push Swap to 5GB during an coding session, it will never go back to zero (or a reasonably low number) unless I reboot the computer.

Maybe having Mac reboot every night (resume working state of all apps of course) can help a tiny bit? Not that this is worth the trouble or is a valid solution at all.
 

thinkingBanana

macrumors newbie
Original poster
Jun 3, 2014
19
10
i give DriveDX a try and will test it for my own.

I have made some fresh install 52 hours ago.
Drivedx numbers host writes 2.7 TB in 51 hours.

i used even the terminal command
iostat -Id disk0
KB/t xfrs MB
25.17 187500 4608.77

(sudo iosnoop) is even fine to monitoring disk activities.
Thanks. I shoot a support email to DriveDx folks; when/if they get back to me, we might get some insights regarding whether the numbers mean what we thought they mean.
 

vitya

macrumors newbie
Jan 3, 2021
2
1
SMART/Health Information (NVMe Log 0x02)
----------
Critical Warning: 0x00
Temperature: 37 Celsius
Available Spare: 100%
Available Spare Threshold: 99%
Percentage Used: 0%
Data Units Read: 10,901,900 [5.58 TB]
Data Units Written: 9,906,549 [5.07 TB]
Host Read Commands: 136,713,020
Host Write Commands: 58,768,114
Controller Busy Time: 0
Power Cycles: 72
Power On Hours: 52
Unsafe Shutdowns: 8
Media and Data Integrity Errors: 0
Error Information Log Entries: 0
----------


This looks normal to me
here is a rule that holds for most Apple SSD's I have seen:

"Divide "Power On Hours" by 10 and this should approximately be equal to the number of TB-read"

In your case, 52 power-on-hours translates to 4-5 TB-read. And that's what you got.


Here is a 4-year old MBP, all working fine
Code:
SMART/Health Information (NVMe Log 0x02)
Critical Warning:                   0x04
Temperature:                        47 Celsius
Available Spare:                    100%
Available Spare Threshold:          10%
Percentage Used:                    100%
Data Units Read:                    891,590,576 [456 TB]
Data Units Written:                 876,679,530 [448 TB]
Host Read Commands:                 7,604,768,224
Host Write Commands:                5,705,224,521
Controller Busy Time:               26,431
Power Cycles:                       7,474
Power On Hours:                     3,944
Unsafe Shutdowns:                   98
Media and Data Integrity Errors:    0
Error Information Log Entries:      0
 
Last edited:

thinkingBanana

macrumors newbie
Original poster
Jun 3, 2014
19
10
"Divide "Power On Hours" by 10 and this should approximately be equal to the number of TB-read"
Thanks for contributing to the topic.

"Power On Hours" should reset to 0 whenever you restart your computer. It is quite impressive that your computer has been powered on for close to half a year though.
 

thinkingBanana

macrumors newbie
Original poster
Jun 3, 2014
19
10
Just want to follow up on this topic, the kind folks from BinaryFruit has responded to my inquiry, I will paste the response below:

First of all, you are trying to compare SSD models from different years of production and very different generations.
Secondly, the TBW parameter has little real value.
In reality, the number of write/erase operations matters and this value has an indirect correlation with the amount of data written (TBW).
When manufacturers specify a TBW warranty, they assume a worst-case workload scenario.
Of course, there is always the possibility that there is a bug in the SSD firmware and it is reporting incorrect values.
But I am now writing to you from the late-2016 MacBook Pro (with SSD 256 GB) where "#7 Data Units Written" indicates 216.0 TB
and "#5 Life Percentage Used" is 69 %.
 

vitya

macrumors newbie
Jan 3, 2021
2
1
Hi there, thinkingBanana :)
I can only assume that you did not read the manual. Go ahead and restart your computer. It's easy to check. I'm not saying that it won't reset for you, maybe, but it certainly should not reset on all the previous models of apple SSDs. If it does, either I learned something new (yay) or you should definitely ask for a replacement. Quick google leads you to specs from Samsung, Seagate, and WD stating that POH does not reset.

However, if you run in the terminal
iostat -Id disk0
that does indeed resets to zero after reboot.

After observing multiple MBPs. the formula I gave you is just an estimate if the MBP is used on a daily basis (at work in my case). You can also see the same holds for a few posts here and on other boards.

Note, if you have MacBook that is older than 5 years, the smart information is different, specifically, power-on-hours are recorded differently.
 
Last edited:
  • Like
Reactions: octoviaa

octoviaa

macrumors regular
Oct 19, 2013
172
88
----------
Critical Warning: 0x00
Temperature: 37 Celsius
Available Spare: 100%
Available Spare Threshold: 99%
Percentage Used: 0%
Data Units Read: 10,901,900 [5.58 TB]
Data Units Written: 9,906,549 [5.07 TB]
Host Read Commands: 136,713,020
Host Write Commands: 58,768,114
Controller Busy Time: 0
Power Cycles: 72
Power On Hours: 52
Unsafe Shutdowns: 8
Media and Data Integrity Errors: 0
Error Information Log Entries: 0
----------


This looks normal to me
here is a rule that holds for most Apple SSD's I have seen:

"Divide "Power On Hours" by 10 and this should approximately be equal to the number of TB-read"

In your case, 52 power-on-hours translates to 4-5 TB-read. And that's what you got.


Here is a 4-year old MBP, all working fine
Code:
SMART/Health Information (NVMe Log 0x02)
Critical Warning:                   0x04
Temperature:                        47 Celsius
Available Spare:                    100%
Available Spare Threshold:          10%
Percentage Used:                    100%
Data Units Read:                    891,590,576 [456 TB]
Data Units Written:                 876,679,530 [448 TB]
Host Read Commands:                 7,604,768,224
Host Write Commands:                5,705,224,521
Controller Busy Time:               26,431
Power Cycles:                       7,474
Power On Hours:                     3,944
Unsafe Shutdowns:                   98
Media and Data Integrity Errors:    0
Error Information Log Entries:      0
I think 4-5 TB write in around 4 to 7 days (or about ±1 TB for 1 day) for light usage is too much.

Your 4 years old SSD (488TB written) though works fine it could already running beyond the designed TBW for your drive (especially if it is less than 1TB capacity, even some 1TB SSD have less than 400TBW in the published spec).

Below is my stats for 1TB SSD in my 2010 Mac Pro:

1614570244587.png


If I use about 12 hours per day, 5.6K hours translate to about 1 year and it written only 4 TB.

The different though is my RAM, I've got about 64GB of RAM so my macOS definitely won't be using swap-file as I've got plenty of RAM. Below is the stats from 'activity monitor' we can see my Mac don't use swap-file.

1614570591319.png


However the swap-file might not be the only one writing to SSD it could be other apps but daily write of more than 20 GB for light usage is I think considered very high already.
 
Register on MacRumors! This sidebar will go away, and you'll see fewer ads.