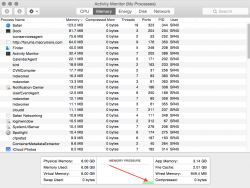
Alright PB3 was not that bad, but PB4/RC1.0 is a resource hog, I have 8 gigs and the kernel_task issue still isnt resolved, it eats up 1.85 gigs REALLY!!!
Alot of the main system wide processes eat up more than 100mb down the line. I've been posting sending feedback about this issue since RC/PB4 came out because this issue was not present in PB3, its just saddening. I really hope that Apple is taking this issue seriously and release an RC 2.0, at least optimize it. I'm thinking that these processes are sending and creating logs so that if feedback is sent they can get a better idea to what is happening, I'm guessing thats why system wide processes are taking up so much memory, hopefully by the RTM release these issues get resolved.
Processes: 222 total, 6 running, 5 stuck, 211 sleeping, 965 threads 06:52:45
Load Avg: 2.36, 2.83, 2.67 CPU usage: 51.65% user, 37.44% sys, 10.90% idle
SharedLibs: 16M resident, 10M data, 0B linkedit. MemRegions: 46518 total, 3403M resident, 138M private, 841M shared.
PhysMem: 7148M used (1571M wired), 1042M unused. VM: 520G vsize, 1063M framework vsize, 0(0) swapins, 0(0) swapouts.
Networks: packets: 2988299/3909M in, 1576704/261M out. Disks: 152033/4152M read, 169243/6134M written.


