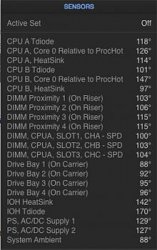
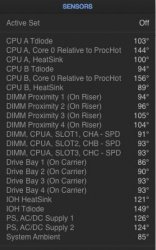
Figures look cool enough . I'll assume Tdiode means Tcase .
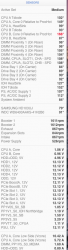
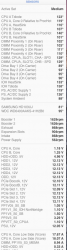
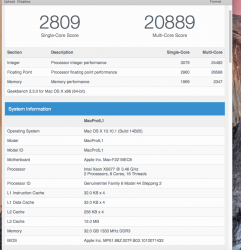
...memory configs and other components only alter score about 5-10 percent . GB is a CPU benchmark , pretty pure one .
Tcase is NOT Tdiode. There is no practical way to measure Tcase for a general cMP user, And Tcase can be 10 degrees (or more) lower than Tdiode. Anyway, My W3690 has a Tcase max 68C, and it can easily run into 86C (Tdiode) without any problem (with the stock fan control, it keep the CPU Tdiode temperature at around 85C under full load). For X5690, it's another 10C buffer (78C Tcase max), so I will say nothing to worry about.
GB score depends on other factors, e.g. how many process running in the background. So, even though after a clean install, may be the spot light index can make the score inaccurate to compare with other machine. For me, as long as it make sense, then everything is OK, no need to achieve the max score. I did play around with the power management system plist files which can lead to my CPU only able to run in 50% performance, that's when GB can tell me the problem. If about 90% of the max score, nothing to worry about. Anyway, in my own test, the memory config will contribute about 5% differences (16600 for 3x8G RAM vs 15800 for 4x8G).
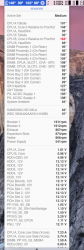
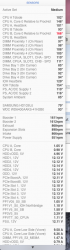
For your info, when stressing the CPU, pay attention to the CPU current, it should stay at least around 80A. If not, that means the stress method is not good enough. You should see something like this:


In my own observation, GB stress can't really keep the CPU at 100% all the way, it fluctuate. I always run OpenCL_NBody_Simulation (switch to CPU multi-core) to assist the stress, then you will see the CPU stay at true 100% (0% idle all the way, load average well above your CPU count, current stay above 81A). Keep this config for 15min, then the temperature and fan speed reading should be stabilised.