FWIW, I captured a spindump while WindowServer was going berserk on my 14" M1 Max; same symptoms (constant ~100% CPU utilization — note that 100% = one core,
not 100% of the entire CPU!), but also:
View attachment 1929726
That's a
lot of memory. More to the point, though, I have a possible suspect:
View attachment 1929727
That is a WindowServer stats collection thread that consumed ~10 seconds of CPU time during a 10-second sample — which corresponds to 100% of one core for 10 seconds. Hmmm.
Here's the same thread after rebooting the system to get WindowServer running normally again:
View attachment 1929728
That's a whopping 7
milliseconds out of the same 10-second sample time — in other words, effectively nothing.
I think what's happening, at least in
this particular case, is that a background stats collection process is getting screwed up somehow and ends up running in an infinite loop, consuming excessive CPU time and leaking a boatload of memory in the process.
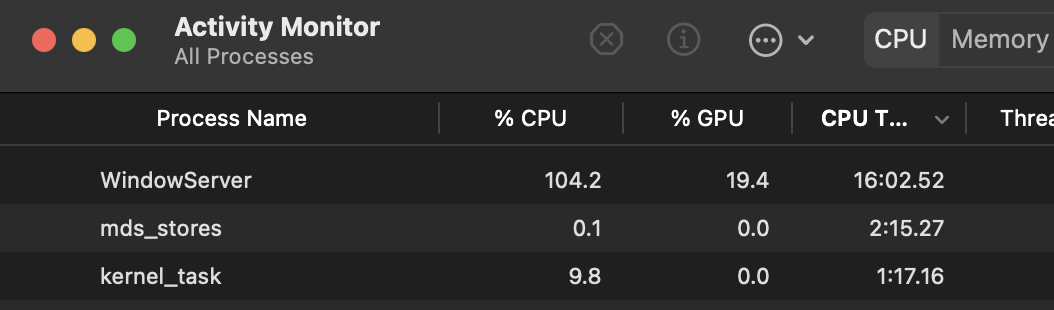
Anyone else want to try to reproduce on their own machine and see if you get the same result? Here's how:
- Start Activity Monitor (it's in /Applications/Utilities)
- Select the CPU tab
- From the View menu, select All Processes
- Sort the list by % CPU, descending (highest utilization on top)
- Find WindowServer in the list and select it
- From the (...) menu at the top of the window, choose Spindump and enter your password if prompted
This will collect a 10-second sample of all running processes, with the selected process at the top of the list below the report header. Search for "com.apple.skylight.stats", and check the value reported for
cpu time (as highlighted in the screenshots above). A value close to 10s would indicate that the same thread is misbehaving as my example here.