I’m back on my BS (not B S, which is “big spam”) and returned to
listening to distant radio on the RTL-SDR USB adapter I bought a year ago, after reading about the
@wicknix post exploring a cheap way to listen to shortwave and amateur radio.
I returned after levelling up from the RTL-SDR kit-included rabbit ear antennas to a cheap, but better antenna (running about USD$30) called a
Youloop — named not after YT, but after a guy named Youssef who came up with the solution.
The improvement in reception quality using the Youloop, and the reduction on background static noise, is incredible.
Tonight, I’m spending my time trawling the megahertz stumbling across two different kinds of pirate radio: one kind is very much like the film,
Pump Up the Volume, in which (so far) three different pirate feeds have been playing music and, earlier, listening to
Brazilian dudes hijack geostationary US military satellites to re-transmit back to earth. They’ve been doing this since the mid aughts, and so long as one has line of sight to one of the satellites (there are four), one can pick them up pretty loudly and clearly.
The one I’m listening to, albeit faintly at the moment, is
being covered in real time on another forum called HFunderground — a forum dedicated to clandestine radio transmissions. Even though the sound quality for the other two music broadcasts have been stronger signals, it’s more the music picks of this DJ which keep making me smile (what makes me smile isn’t always whether I like the song, but rather the way a DJ picks what they play and how well they keep you on your toes).
To listen, I’m using the current build of gqrx (via Macports) on High Sierra, on my 2013 iMac. I’d much prefer to use a more recent version of gqrx on Snow Lepoard (more recent than, uh, 2013, as later versions began to rely on Qt5.5, which only works with Mountain Lion onward). Later-than-2013 versions, if they could be cobbled together, would allow me to use my A1261 and also bookmark signals I pick up (a feature which didn’t yet exist in the 2013 version), as well as letting me physically move about to find whether I could pick up a better signal (like, say, on a hilltop at a nearby city park).
Anyway, for less than, like, $70 spent over the course of a year, it’s amazing how much fun picking up distant radio can be on older gear.

Updating the above combination of RTL-SDR and the Youloop antenna, I was able to finally capture my first-ever digital image from, literally, a radio signal.
Last evening, I recorded the signal for the NOAA-18 weather satellite as it passed fairly close by here. I was hoping the now-abandonware application,
WXtoImg, could decode the signal. Unfortunately, I had to sort through a bunch of quirks in learning how decoding works. After tinkering with it for an hour last night, I gave up on it.
Today, after work, I went back to the audio file. The audible file I recorded sounded identical to this
reference sample, so I was sure that I’d recorded
some usable data. Then I realized something: gqrx records audio in two-channel, 48kHz — not unlike a DAT recorder. The WXtoImg application, meanwhile, only recognizes up to 44.1 kHz — not unlike a CD or AIF/WAV file. So, I brought down the recording to monaural, 44.1 kHz, and suddenly, WXtoImg could parse it:
The date on the header is wrong: it reflects when I saved that modified file, not when it was recorded (also, it displays as NOAA-19, not NOAA-18). But this was part of the image data I caught last night.
It looks low-res because it’s intended to be a low-res transmission sent at a low frequency (137.9125 MHz, to be precise — just a bit higher from FM broadcasts). The bandwidth is something like 40 kHz (an FM radio station is, like, 160 kHz wide).
The high-res images we’re used to seeing on weather reports and forecasts come from a separate transmission downlink sent at a much higher frequency (I don’t remember the frequency, but it’s something like 2GHz or above — at least on par with wifi- and mobile phone-type frequencies), where much more bandwidth can be used to transmit. Like wifi and mobile devices, GHz-level frequencies is also more susceptible to any solid object blocking the line-of-sight between transmitter (on the satellite) and the receiver (on the ground).
Anyway,
I found this exciting, personally, because I didn’t think I could do it. Also, there’s more to to the image than what you see in the screencap (which I’ve attached), but I may be unable to properly decode it (yet) and/or see how it superimposes onto a map. The UI on WXtoImg is pretty clunky, at best, and decades out of date, at worst. But heck, at least it parsed this!
Next thing I hope to learn is how to capture an image from a mode called “
SSTV” — “slow-scan television” — which is a technique those aforementioned music radio pirates use to identify themselves before they begin a music show. They’re basically digital-to-analogue colour pictures. As for how decoding those go, I have no idea, but I’m up for the challenge!
EDIT to amend! I was wrong about the 48—>44.1 downsample! I tinkered about with the data even further, and looking in some obscure setting panel, was informed that NOAA satellites transmit
specifically at 11.025 kHz. So I opened WXtoImg to display “expert” mode. This enabled me to change the satellite to the correct one. Meanwhile, I re-saved the audio data from last night as 11.025 kHz. I also touch’d the file with as close to the moment when I recorded it last night, give or take ten minutes. I opened it, again, in WXtoImg, and LO AND BEHOLD:
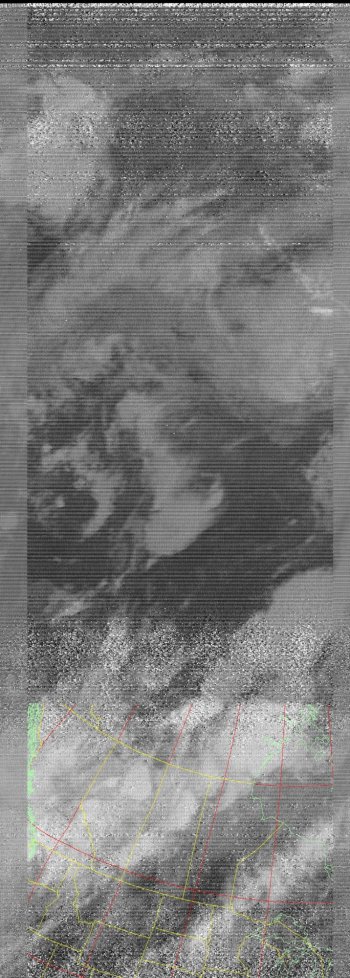
I had to remove the map overlay, because it wasn’t matched up (and even when I used WXtoImg to move the map overlay, the shift in angle was still wrong — my best guess being something related to the North American Datum projection is either unspecified or wrong). The image was
much clearer AND the data embedded in that file also included IR cloud-top temperatures!
I am now truly amazed and humbled, but also baffled by what else is buried in all that data.
SECOND UPDATE: I’ve included tonight’s nearest pass of the same satellite. For whatever reason, there seemed to be more interference, but there’s enough visible to give an idea of how weather has moved eastward in the past 24 hours or so.