Become a MacRumors Supporter for $50/year with no ads, ability to filter front page stories, and private forums.

Toutou

macrumors 65816
Jan 6, 2015
1,082
1,575
Prague, Czech Republic
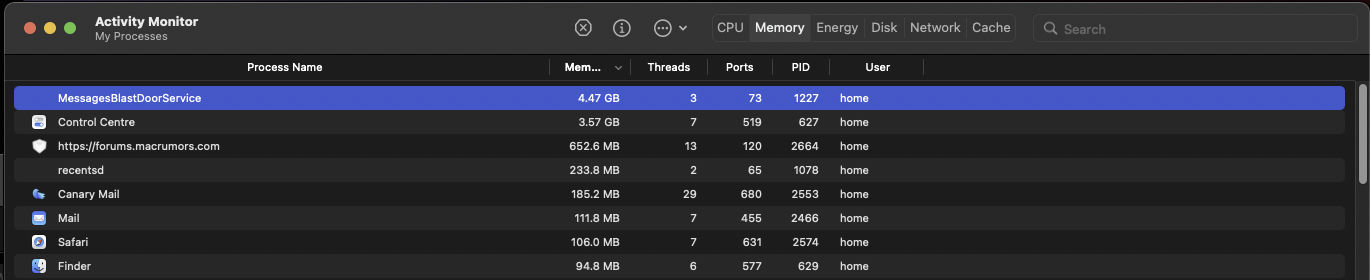
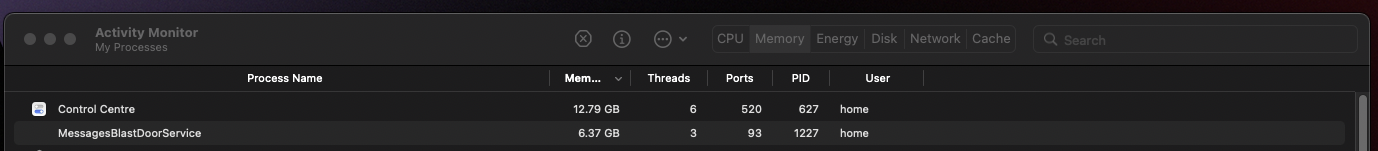
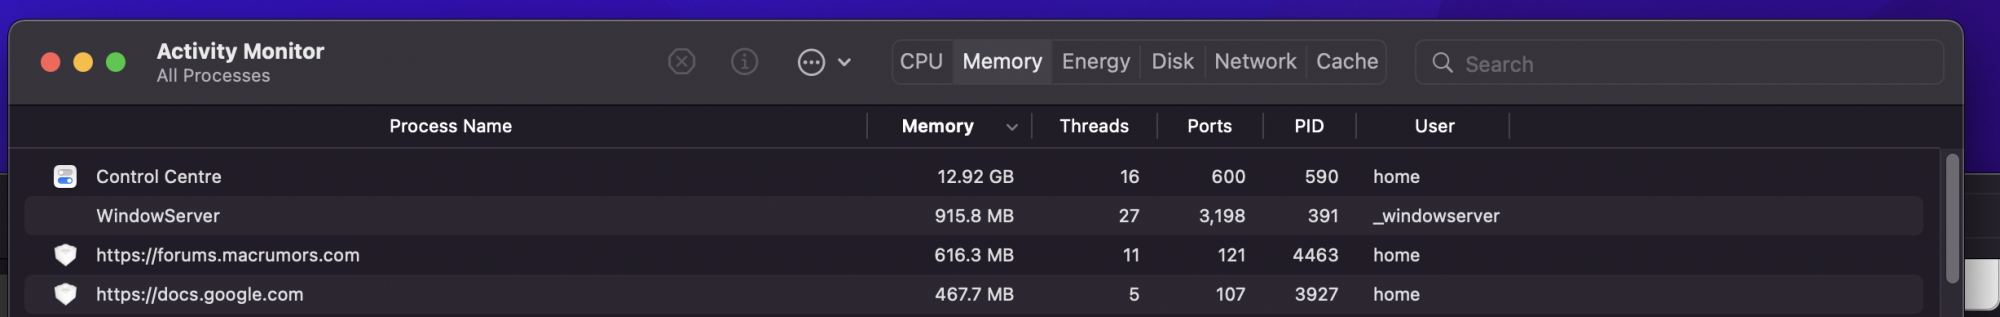
445.42 GB memory leak
Look at that virtual memory size. 445.42 GB
421.98 Virtual memory size still very high.
I'm seeing enormous virtual memory usage in quite a few apps.

There's a reason why the Virtual memory number isn't shown anywhere more visible. The number actually means something else than you think.
Most people confuse the concept of "virtual memory" with "swap", mainly because, AFAIK there was a time when Apple did call swap virtual memory.

What the number actually means is the size of all virtual memory regions allocated to the process.
So unless you're absolutely sure you know what virtual memory is (and no, it's not "memory on the SSD" or anything like that), you should not worry about the number. It's perfectly okay.

For those who know what virtual memory is and are still baffled by the number, you can inspect a process' virtual memory regions using
Code:
vmmap $PID
and you can grep for regions called "commpage" and "GPU Carveout"
 

wilberforce

macrumors 68030
Aug 15, 2020
2,915
3,184
SF Bay Area
So that brings about the question of whether or not this is a bug or a "feature". It could be that LR is seeing a bunch of free memory, and saying "well heck, I might as well use this with the GPU to cache image data rather than just letting it sit there unused."
Possibly, but it is not actually unused. Either macos is incorrectly telling LR it is unused, or LR is incorrectly assuming it is unused.
 
  • Like
Reactions: armoured

armoured

macrumors regular
Feb 1, 2018
211
163
ether
Possibly, but it is not actually unused. Either macos is incorrectly telling LR it is unused, or LR is incorrectly assuming it is unused.
I'd add - if the idea is that LR is using memory that macos or lightroom considers 'unused', that number should basically be the same whether or not LR has graphics acceleration turned on.

If it behaves very differently like this (again, accepting the premise that LR is doing this intentionally), then clearly LR's memory model and gfx approach does not understand the gfx or unified memory model and tools of the M1 platform.

I still think most likely LR is using some of its own tools for gfx/memory mgmt that haven't yet been fully updated to the M1 / macos model (macos's own internal tools were designed for just this case).
 

alien3dx

macrumors 68020
Feb 12, 2017
2,188
525
scary , by mean logical . Are you cache image and how much those image size . If you got 400 gb file image kinda wrong to cache all into ram. The proper way is if lightroom create thumbail and upon click you can edit what you want . If lightroom resize all image on the spot kinda scary for computer.

If possible lower the cache or target the folder if possible

** only mind of a developer.
 

altaic

macrumors 6502a
Jan 26, 2004
689
464
There's a reason why the Virtual memory number isn't shown anywhere more visible. The number actually means something else than you think.
Most people confuse the concept of "virtual memory" with "swap", mainly because, AFAIK there was a time when Apple did call swap virtual memory.

What the number actually means is the size of all virtual memory regions allocated to the process.
So unless you're absolutely sure you know what virtual memory is (and no, it's not "memory on the SSD" or anything like that), you should not worry about the number. It's perfectly okay.

For those who know what virtual memory is and are still baffled by the number, you can inspect a process' virtual memory regions using
Code:
vmmap $PID
and you can grep for regions called "commpage" and "GPU Carveout"
The 384GB region (0x1000000000-0x7000000000) is present in both the arm64 process (as "commpage") and x86_64/rosetta process (separate from commpage as "GPU Carveout"), but Activity Monitor reports 390GB of VM for the arm64 process and 34GB of VM for the x86_64 process.

It looks like vmmap and Activity Monitor are misidentifying both of the fixed regions (commpage and GPU Carveout) on arm64 processes. Though, TBH, it seems to me that neither should be included in the VM size total anyway. David Elliot has a good post on his blog with a section talking about commpage.

Interestingly, the GPU Carveout region appears to have been added to the kernel 11 months ago according to git blame on the XNU GitHub repo, but I can't find any documentation on it. I'm guessing it represents a sort of GPU scratchpad for large datasets (stored temporarily in RAM, on the SSD, wherever).

Anyway, wrapping back to the topic of the thread, maybe the misidentification of those regions in arm64 processes is causing overallocation in some apps. Anyone want to try running LR under Rosetta (check the box in the Finder info panel)?

Edit: s/arm64e/arm64/ (codesign misreports the arch as arm64e)

Edit 2: Hmm, codesign is actually correct and I confirmed with otool (cputype 16777228 with cpusubtype 0 is arm64, cpusubtype 1 is arm64_v8, and cpusubtype 2 is arm64e). Calculator.app may be arm64e since it's a system app, though I thought arm64e was reserved for kernel space... Either way, the kernel refuses to execute it in user space after I re-signed it with debugging entitlements. In case anyone else runs into this, the log entry is: exec_mach_imgact: not running binary "Calculator" built against preview arm64e ABI
 
Last edited:

Outer_net

macrumors newbie
Original poster
Aug 6, 2021
28
6
It may be too early to call it a fix but so far a step that ? senior Tech got me to take may have worked.

More testing is needed and will see how it goes.

So the volume disk structure on out OOTB Mac Book Pros seems to be incorrect and requiring a complete erase.
After taking this step i‘m not seeing the MacOS processes Control Centre or messages blast door gobble up excessive amounts of RAM.

It was a small difference the 2 images say it all - no snapshot volume after the erase and the Data volume is correct.

Portrait screenshot is before and landscape is after.

Maybe this is just Apple buying themselves more time but what the tech said does seem to make sense, because the volumes where not correct the unified memory was not being provisioned correctly, it worked but not without errors.
As errors showed with MacOS processes these would be even worse with 3rd party apps.

I really hope it does fix this as after only 10 days I have created 3 new user accounts a new partition and reinstalled 2 x and complete volume erase, and also onto adobe support.

If it does turn out to be a fix then this would mean Apple are sending out Machines with SSD‘s that do not have the correct volume structure.

Proceeding optimistically / cautiously

@Toutou is spot on about the VM and its an education ?
 

Attachments

  • 2566AABD-E1BF-457A-9748-5FE2F9F3BA4E.jpeg
    2566AABD-E1BF-457A-9748-5FE2F9F3BA4E.jpeg
    630.4 KB · Views: 219
  • Screenshot 2021-11-07 at 17.41.55.png
    Screenshot 2021-11-07 at 17.41.55.png
    68.2 KB · Views: 195
Last edited:

Krevnik

macrumors 601
Sep 8, 2003
4,101
1,312
It was a small difference the 2 images say it all - no snapshot volume after the erase and the Data volume is correct.

The Data volume being incorrect would be a concern, but unfortunately it isn't clear that it is from a screenshot alone (i.e. what did the OS think the disk space went to?). That said, the "no snapshot volume" on the second screenshot seems to be because "Macintosh HD" disclosure triangle is closed in the second screenshot, not because there isn't one. macOS uses snapshots of the OS volume to boot from with Big Sur and later. That's normal, and not having one would be a bad thing.

That said, I don't know how a partitioning error can lead to "unified memory not being provisioned correctly"? The two are unrelated.

The 384GB region (0x1000000000-0x7000000000) is present in both the arm64 process (as "commpage") and x86_64/rosetta process (separate from commpage as "GPU Carveout"), but Activity Monitor reports 390GB of VM for the arm64 process and 34GB of VM for the x86_64 process.

It looks like vmmap and Activity Monitor are misidentifying both of the fixed regions (commpage and GPU Carveout) on arm64 processes. Though, TBH, it seems to me that neither should be included in the VM size total anyway. David Elliot has a good post on his blog with a section talking about commpage.

That would certainly explain the VM readings being seen.
 

zarathu

macrumors 6502a
May 14, 2003
632
358
You like me and almost everyone who uses Monterey has the dreaded memory leak bug. Apple will fix it eventually.


Before then there is a simple temporary solution. Presumably you have several desktops on your mac. I have 11 at the moment. Go to one you don’t use often and open up Activity Monitor(its in your applications and on every mac). Leave it open all the time. Click on the column that tells you the use of memory by system processes and apps. Highlight(click on) any that look completely out of control, and then click on the little icon with the x in the middle of a circle. Choose force quit. If its an app it will quit and you will have to restart it. If its a process(weird names mostly) then it will quit but come back almost instantly in the small size it's supposed to be. For me about 15 minutes ago I noticed that the most common culprit, Control Center(which normally uses about 26 mb of memory) was slowly sucking more and was up to 144mb. Earlier this week I found it at 14 GB.


You can keep these little buggers from stealing memory by just keeping an eye on them. Be advised: if WindowServer is up at 1gb then its probably doing it too, and if you force quit that one, your screen will go black for about 5 seconds while the OS puts it back, and then you will have to type in your machine password again.


Hope this helps.
 
  • Like
Reactions: Tofupunch

Outer_net

macrumors newbie
Original poster
Aug 6, 2021
28
6
Its so bloody annoying Apple can't call it what it is and say they screwed up Monterey.

Instead they are happy for us to uninstall reinstall - erase partition - basically have us dancing around the problem

I am right back where it started again now with MessagesBlastDoorService and Control Centre both using anywhere between 3 -6 gb each

Lightroom Classic built standard previews for 10k images and didn't even break a sweat on under 2gb
 

Attachments

  • Screenshot 2021-11-08 at 09.35.02.png
    Screenshot 2021-11-08 at 09.35.02.png
    126.9 KB · Views: 112

Outer_net

macrumors newbie
Original poster
Aug 6, 2021
28
6
After a complete disk erase and reinstall it took 5 hrs and Control centre was back upto 12.79 GB and MessageBlastDoorService at 6.37 GB

In typical Apple fashion they are putting the pressure on suggesting to get it replaced in the store as I only have 3 days left of the 14 days to return.

I imagine at this stage if Apple are prepared to keep quite and have users take disruptive steps the best we can hope for is a silent fix being slipped into the next Monterey update - They should have an internal article on this already and advise customers honestly instead of having them take pointless steps, wasting our time.

Is there any chance this is a hardware issue ? Having spoken to 4 senior techs now I am amazed how dumb they are all playing, its like they can't even say Memory leak! Do any of them read the bloody tech news?
 

Attachments

  • Screenshot 2021-11-08 at 13.10.25.png
    Screenshot 2021-11-08 at 13.10.25.png
    90.4 KB · Views: 115

altaic

macrumors 6502a
Jan 26, 2004
689
464
After a complete disk erase and reinstall it took 5 hrs and Control centre was back upto 12.79 GB and MessageBlastDoorService at 6.37 GB

In typical Apple fashion they are putting the pressure on suggesting to get it replaced in the store as I only have 3 days left of the 14 days to return.

I imagine at this stage if Apple are prepared to keep quite and have users take disruptive steps the best we can hope for is a silent fix being slipped into the next Monterey update - They should have an internal article on this already and advise customers honestly instead of having them take pointless steps, wasting our time.

Is there any chance this is a hardware issue ? Having spoken to 4 senior techs now I am amazed how dumb they are all playing, its like they can't even say Memory leak! Do any of them read the bloody tech news?
It is 100% a common software bug in Control Center.app. Not hardware or your install. Don't panic.

I'm sure it'll be fixed in the next Monterey update. In the meantime just kill the Control Center process if it gets out of control.

Edit: I hadn't seen reports of MessagesBlastDoorService leaking before. Not sure what's up with that.
 
Last edited:

altaic

macrumors 6502a
Jan 26, 2004
689
464
So, I wasn't experiencing any issues with MessagesBlastDoorService, but I was curious if it would relaunch using less memory so I killed it. It didn't relaunch... An hour later I was just about to reboot (which should bring it back), but then I noticed that Control Center hadn't leaked much or maybe at all (the memory usage was something like 80 MB, as opposed to multiple GB that I'd been experiencing). Very odd. MessagesBlastDoorService shouldn't have anything to do with Control Center.

Edit: MessagesBlastDoorService didn't relaunch with a reboot... And there's still no sign of the Control Center memory leak. There is also a new thread about the MessagesBlastDoorService process using a lot of CPU/energy, which shows it accessing the Photos library. The BlastDoor service is supposed to provide Messages with some extra security, so it's a little weird. My curiosity is piqued.
 
Last edited:

Outer_net

macrumors newbie
Original poster
Aug 6, 2021
28
6
Spoke to a Apple senior tech today who escalated it to engineers. He came back to me from the engineers and said they are aware of the issue and are working on it and will be around 2 - 3 weeks for an MacOs update to fix the issue.

He also advised and said the engineers concurred that the best step is to take the device back to the store for a replacemnet as they are seeing reports that not all Mac book Pro’s are affected. He explained to me that the issue is more common with custom configured MBP‘s and suggested that there may be no issue at all on a new replacement device.

This has confused me ? as on the one hand they are saying that it is a software issue and can be fixed although not all devices are affected then at the same time the issue may not be present on a replacement machine.

How can both be true? How can it only be a software issue that is totally fixable yet the issue may not be present on a replacement machine?

After a year long issue with an intel 16” mbp that thankfully resulted in a refund I am really starting to feel that Apple are only interested in keeping good appearances and full of ?.

I have had Adobe lightroom freeze up daily and pixelmator / safari and many other apps stop responding and either recover after several minutes or crash - these are the issues that are messing with my daily workload. MacOs processes running wild and poor battery life as a result are annoying but nowhere nearly as much as a faulty buggy machine that keeps crapping out on me.

No doubt its an amazing machine but the ? factor / experience is seriously compromised if the software doesn't it up. Its a bit like having a stunning car parked up in a garage on rolling wheels all day and your in the driving seat breathing in the fumes.
 
  • Like
Reactions: g75d3

altaic

macrumors 6502a
Jan 26, 2004
689
464
Spoke to a Apple senior tech today who escalated it to engineers. He came back to me from the engineers and said they are aware of the issue and are working on it and will be around 2 - 3 weeks for an MacOs update to fix the issue.

He also advised and said the engineers concurred that the best step is to take the device back to the store for a replacemnet as they are seeing reports that not all Mac book Pro’s are affected. He explained to me that the issue is more common with custom configured MBP‘s and suggested that there may be no issue at all on a new replacement device.

This has confused me ? as on the one hand they are saying that it is a software issue and can be fixed although not all devices are affected then at the same time the issue may not be present on a replacement machine.

How can both be true? How can it only be a software issue that is totally fixable yet the issue may not be present on a replacement machine?

After a year long issue with an intel 16” mbp that thankfully resulted in a refund I am really starting to feel that Apple are only interested in keeping good appearances and full of ?.

I have had Adobe lightroom freeze up daily and pixelmator / safari and many other apps stop responding and either recover after several minutes or crash - these are the issues that are messing with my daily workload. MacOs processes running wild and poor battery life as a result are annoying but nowhere nearly as much as a faulty buggy machine that keeps crapping out on me.

No doubt its an amazing machine but the ? factor / experience is seriously compromised if the software doesn't it up. Its a bit like having a stunning car parked up in a garage on rolling wheels all day and your in the driving seat breathing in the fumes.
In another thread someone reported memory usage of 160 GB, but had normal memory pressure and no swap. In other words, Monterey deals with the memory leak so it doesn't actually affect anything.

As far as Adobe goes, maybe get in touch with their support department. I haven't had any stability issues (which is a separate issue from benign memory leaks), so perhaps you do have a hardware issue and should get a replacement.
 

white7561

macrumors 6502a
Jun 28, 2016
934
386
World
In another thread someone reported memory usage of 160 GB, but had normal memory pressure and no swap. In other words, Monterey deals with the memory leak so it doesn't actually affect anything.

As far as Adobe goes, maybe get in touch with their support department. I haven't had any stability issues (which is a separate issue from benign memory leaks), so perhaps you do have a hardware issue and should get a replacement.
Last time I got the control center memory leak, on activity monitor it registers the memory leak into the VM compressed tab. Which is prob why it doesn't really affect the mem pressure
 
  • Like
Reactions: altaic

altaic

macrumors 6502a
Jan 26, 2004
689
464
Last time I got the control center memory leak, on activity monitor it registers the memory leak into the VM compressed tab. Which is prob why it doesn't really affect the mem pressure
Ah cool, that's what I'd hoped. vmmap showed lots of small (16 KB - 112 KB) VM_ALLOCATE regions that increase in number over time, which probably compress pretty well.
 
  • Like
Reactions: white7561

macphoto861

macrumors 6502
May 20, 2021
494
436
He also advised and said the engineers concurred that the best step is to take the device back to the store for a replacemnet as they are seeing reports that not all Mac book Pro’s are affected. He explained to me that the issue is more common with custom configured MBP‘s and suggested that there may be no issue at all on a new replacement device.

This has confused me ? as on the one hand they are saying that it is a software issue and can be fixed although not all devices are affected then at the same time the issue may not be present on a replacement machine.

How can both be true? How can it only be a software issue that is totally fixable yet the issue may not be present on a replacement machine?
FWIW, I'm not really seeing much (if any) memory leak issues on mine ("stock" M1Max). Lightroom Classic sometimes uses a bit more ram than I am accustomed to, but nowhere near what the screenshot you originally posted shows, nor am I seeing Control Center's memory usage skyrocketing.

Just speaking from layman's terms, is it possible that it could indeed be a software problem, but one that is somehow triggered by small manufacturing variations between units (or just with specific configurations)?
 

tmacer

macrumors newbie
Nov 10, 2021
3
1
Agreed with @altaic. All arm64e processes report 390+GB of virtual memory but system is behaving normal - might just be a reporting error. As for the memory leak: I don't have any extreme values like some of you but after a few days without restarting "Window Server" and "Google Chrome Helper" keeps getting bigger and bigger with memory values of at least 5GB to sometimes 10 GB or more each, making the machine feel slow and sluggish - restarting solves this. This is also irrespective of the windows open or monitors used and also irrespective of the tabs opened for Google Chrome. It seems to just happen overtime with use and then always ends in a slow machine after a while.
 

Outer_net

macrumors newbie
Original poster
Aug 6, 2021
28
6
The Data volume being incorrect would be a concern, but unfortunately it isn't clear that it is from a screenshot alone (i.e. what did the OS think the disk space went to?). That said, the "no snapshot volume" on the second screenshot seems to be because "Macintosh HD" disclosure triangle is closed in the second screenshot, not because there isn't one. macOS uses snapshots of the OS volume to boot from with Big Sur and later. That's normal, and not having one would be a bad thing.

That said, I don't know how a partitioning error can lead to "unified memory not being provisioned correctly"? The two are unrelated.


That would certainly explain the VM readings being seen.
Hi @altaic

In disk utility this is how it looks now

Other than photos / safari and a few other apple apps (Keep stop responding) the system seems to have stabilised now.

MessageBlastDoorService is definitely amongst other things working as a process for people processing from photos app - still 9.8 k more to go.

It seems that the number of sleep / wake cycles definitely increases the ram exponentially for some system processes.

As far as Lightroom goes it has really settled down now and no more crashes.

I found out today that there's no more PR Ram resets on the M1's and also no SMC resets required. Apparently shutting down and closing the lid for 30 seconds does both of those.

Also it seems there's a new revive firmware option for any mis behaving M1 devices - Probably what they would call a software repair in store - Only thing is it looks like you need another M1 Mac.

Does anyone know where to find a list of known Monterey bugs?
 

Attachments

  • IMG_5217.jpeg
    IMG_5217.jpeg
    308.4 KB · Views: 117

Outer_net

macrumors newbie
Original poster
Aug 6, 2021
28
6
Same old ? :(:(

Why doesn't Apple release a fix for this already?

After doing everything they asked it is still happening

Now its safari tabs also that are using far too much memory than they should
 

Attachments

  • Screenshot 2021-11-23 at 13.38.15.png
    Screenshot 2021-11-23 at 13.38.15.png
    365.3 KB · Views: 110

Outer_net

macrumors newbie
Original poster
Aug 6, 2021
28
6
Whatever the reason for random Apple system processes going savage on the ram it shouldn't be happening and any other 3rd party apps should not impact Apples sandboxed core processes.
 

mi7chy

macrumors G4
Oct 24, 2014
10,522
11,172
It's karma for all the hypsters claiming 8GB = 16GB. Now 64GB = 32GB with the memory leak.
 

Outer_net

macrumors newbie
Original poster
Aug 6, 2021
28
6
Except if you're not a hipster and your just tired of Apple releasing stuff before its tried and tested. Just trying to get some answers as am feeling like a bit of a beta tester atm.

If Apple don't officially recognise this issue then there's nothing to fix on the next OS update - Or they just get away with messing us all around uninstalling re installing wiping off SSD's when all the long they just need to release a fix albeit a silent unexplained one.
 

hmorneau

macrumors regular
Jan 4, 2016
201
133
Memory pressure at +60% and 8Gb of swap used on my M1 Pro 16GB, looking forward to receive my M1 Max 32GB. 64GB is tempting.
 
Register on MacRumors! This sidebar will go away, and you'll see fewer ads.