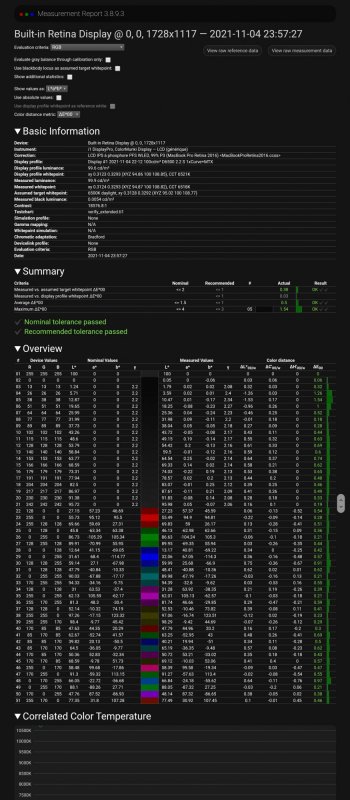
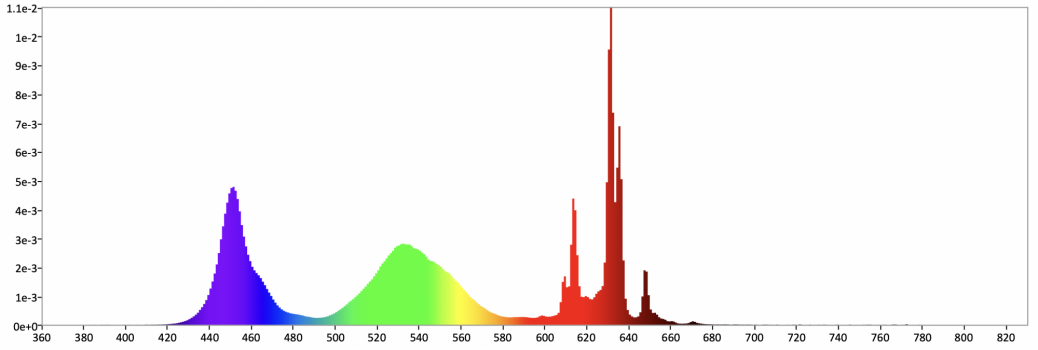
In theory, you can use any meter to measure the display, the question is, 'how accurate will that measurement be'? The MacBook Pro XDR uses a PFS Phosphor based LCD display which has spikes in the red (see attached spectral power distribution). Because of this spike, it is important to use a spectral radiometer with enough spectral bandwidth to properly categorize the display's performance. A meter with lower bandwidth may not have the resolution to accurately measure the spike. Of course, this isn't only on the XDR Display but any display that uses PFS Phosphor. If a colorimeter is properly profiled with the MacBook Pro Display XDR, it should have fairly good accuracy, but a generic profile may have larger error than desired. When profiling, or calibrating a colorimeter, the most common method is to use a matrix calibration, which measures WRGB, this takes into account the filters and gamut of the display and without the company disclosing what they used to calibrate that profile it is difficult to be certain of the accuracy of the profile; of course, you could test it, but if you have a spectral radiometer why waste the time! ")
While not on the Pro Display XDR, we have had some colleagues test PFS Phosphor displays and the error between spectral radiometers that may occur. They found that the difference between a 5nm spectral bandwidth meter and a 2nm spectral bandwidth meter can have an error (difference) of +/- .006 on the red y. On the sample MacBook Pro XDR display, the error we measured out-of-the-box was approximately .004 on the y-- in this case using an improper meter could add more error than out-of-the-box.
Many meters don't require Windows, but the software we happened to be using to plot and chart the data is Windows based. We could have easily used Patterns to put up the white, measure with the meter, enter the Fine-Tune, and called it a day, but it wouldn't easily allow for a validation of the result and the charts we were able to provide on the thread.
Attachments
Last edited: