Become a MacRumors Supporter for $50/year with no ads, ability to filter front page stories, and private forums.

qnxor

macrumors member
Original poster
May 2, 2014
78
0
Hi all,

2014-05-13: v1.3 beta - Prime95 can now be automatically started from the menu which also has added Prime95 options
2014-05-09: v1.2 beta - Added GpuTest, Prime95, Longer x264, GPU switch to force either the Intel GPU or Nvidia GPU, possibility to monitor your own command, more command line options, etc. Description and download on https://github.com/qnxor/macoh (download ZIP link on right side)

Try it and post your graphs here (don't forget your Mac and OS specs and ambient temperature).

--

Inspired by this post, I wanted to test for CPU throttling and overheating. I wrote a script that automates stress testing and plots a graph to reveal any throttling or overheating - all in a single command.

It's open source on GitHub (with full description): http://[B]https://github.com/qnxor/macoh[/B]

It automates the entire process, including the download of necessary test and plotting tools, and plots the CPU temperature and frequency after the test is done. It's simple to use: fetch it from GitHub, launch Terminal and type
Code:
bash macoh.sh
then follow the old-school menu.

It would be nice if you tried it and posted the generated graphs in this thread (post your Mac specs and OS info too). Open an issue on GitHub if it doesn't work for you, or if you have suggestions.

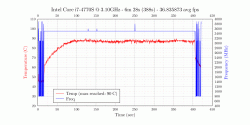
Ambient temperature is very important. The graphs below were obtained at 24 C ambient, on a 15" rMBP Late 2013 2.3 GHz with Nvidia GT 750M discrete GPU:

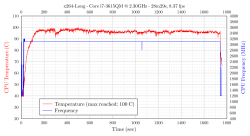
x264 transcoding, long version (no throttling)
x264-long.png


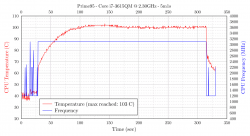
Prime95 (heavy throttling, expected)
prime95.png


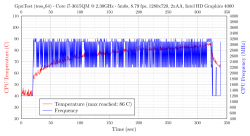
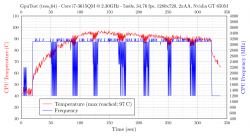
3D GpuTest using the discrete Nvidia GPU (no throttling)
gputest-gt750m.png


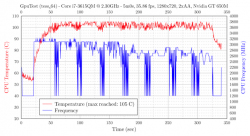
3D GpuTest using the integrated Intel Iris Pro (throttling, not unexpected)
gputest-irispro.png


Laptops may or may not throttle in the x264 test. Mine did not (but this guy's did). I expect pretty much all laptops to throttle in Prime95. I was also expecting the CPU to throttle in the 3D test more when using the integrated Intel Iris Pro GPU than when using the Nvidia GPU, because it is harder to cool a single hot surface (CPU + Intel Iris Pro) than two less hot surfaces (CPU + Nvidia). Things got better once fans hit full speed (the max frequency was still lower though).

Bogdan
http://www.damtp.cam.ac.uk/research/afha/bogdan

p.s. Given it's my first time ever using a Mac, if the pros here spot inefficiencies, then by all means, I'm all ears.
 
Last edited:

yjchua95

macrumors 604
Apr 23, 2011
6,725
233
GVA, KUL, MEL (current), ZQN
Hi all,

Got my hands on a MBP today (first time using a Mac) and, inspired by this post, I wanted to test for CPU throttling and overheating. I wrote a script that automates stress testing and plots a graph to reveal any throttling or overheating - all in pretty much a single command.

It's open source on GitHub: http://[B]https://github.com/qnxor/macoh[/B]

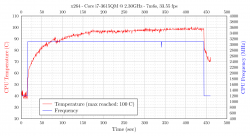
As detailed on GitHub, it automates all of the following: downloads and installs needed tools, a H264 movie (Big Buck Bunny), transcodes it via HandBrake x264 + extra filters, monitors and logs temperature and frequency, and finally plots a graph of temperature and frequency against time to reveal any throttling or overheating. The output graph looks like this:

Image

The above graph shows no throttling. If there was any, the frequency would go down during encoding, like so.

The script is simple to use, with an old school command-line interface. Fetch it from GitHub, launch Terminal and type
Code:
bash macoh-x264.sh
then choose 0 from the menu. More info on GitHub. Make sure you quit all other apps (HandBrake is slowed down otherwise and won't stress the CPU as much).

Some of my colleagues asked me to release this. I only tested it on Mavericks but should work on most recent Macs. Just open an issue on GitHub if it doesn't work for you, or if you have suggestions (see my Todo list as well). I'll do my best to fix bugs that prevent you from using it. If it works for you on anything other than 10.9.2 and i7-4850HQ then let me know so I can add it to the compatibility list.

It would be nice if people here also tried it and posted the generated graph in this thread. Let me know how you get on.

Bogdan
http://www.damtp.cam.ac.uk/research/afha/bogdan

p.s. Given it's my first time ever using a Mac, if the pros here spot inefficiencies, then by all means, I'm all ears. I did plan a list of improvements already.

A superb tool.

Here's one from my 21.5" iMac (3.1GHz i7, 16GB RAM and 256GB SSD).

No throttling at all.
 

Attachments

  • 20140503-105057-graph.gif
    20140503-105057-graph.gif
    65.9 KB · Views: 909
Last edited:
  • Like
Reactions: B S Magnet

dmccloud

macrumors 68040
Sep 7, 2009
3,150
1,903
Anchorage, AK
Looks like I had some throttling, but I also had other apps running. Gonna run it one more time with everything closed.
 

Attachments

  • Screen Shot 2014-05-02 at 11.37.00 PM.jpg
    Screen Shot 2014-05-02 at 11.37.00 PM.jpg
    395.1 KB · Views: 608

qnxor

macrumors member
Original poster
May 2, 2014
78
0
Looks like I had some throttling, but I also had other apps running. Gonna run it one more time with everything closed.

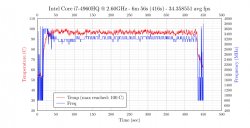
It seems the freq was mostly 3.3 GHz in the second half. The freq is decreased as part of Intel spec when multiple cores go turbo. 3.8 GHz is possible on your CPU but only with a single core. 3.3 GHz with all cores in turbo seems a bit low (will have to check the specs).

Still: Interesting to see that the 2.6 Ghz MBP with i7-4960HQ was topping out at 3.3 GHz when all cores were pushed, which is the same max frequency I get on the 2.3 GHz MBP with i7-4850HQ at 24C ambient temperature. It seems that your 2.6 GHz overheats more - not unexpected (it's just an overclocked version really) but it may also be that your Mac has an inefficiently applied thermal paste on the heatsink -- if you're brave enough, you could open it up and replace it with a better one and a thinner layer (Apple, like many other manufacturers, is known for using too much paste unfortunately).

You might also want to quit (not just close) all apps and rerun. Handbrake is slowed down if other stuff is running as it starts with a very low cpu priority. You should expect more heat if there nothing else running (you could also bump HandBrake's priority using "renice").

I'll add a "long test" option where the x264 encoding takes longer (15mins or so) to allow for more heat build up.

IMPORTANT: The ambient temperature is crucial. Contrary to popular belief, the dependency on amb temp is not linear.
 
Last edited:

laurihoefs

macrumors 6502a
Mar 1, 2013
793
23
This is a mid-2012 base model running OS X 10.9.3 build 13D45a:
attachment.php


Ambient temp was ~19°C.


As a side note: I've had issues running Handbrake ever since I've had this rMBP, from OS X 10.8.1 to 10.9.3. For some reason it always at first utilizes only ~50% of available CPU time, and if I kill and restart it, it'll then run at full speed. Same thing happened here, at first I was getting an average of 15fps, on the second run I got closer to 30fps. I haven't found a solution to this, and use it so rarely it's hardly an issue, but I'm just curious if others have experienced this?
 

Attachments

  • 20140503-164943-graph.gif
    20140503-164943-graph.gif
    52.6 KB · Views: 6,384

qnxor

macrumors member
Original poster
May 2, 2014
78
0
Ambient temp was ~19°C.

As a side note: I've had issues running Handbrake ever since I've had this rMBP, from OS X 10.8.1 to 10.9.3. For some reason it always at first utilizes only ~50% of available CPU time, and if I kill and restart it, it'll then run at full speed. Same thing happened here, at first I was getting an average of 15fps, on the second run I got closer to 30fps. I haven't found a solution to this, and use it so rarely it's hardly an issue, but I'm just curious if others have experienced this?

You just reminded me that I didn't incorporate nice and ionice for HandBrake (cpu and i/o priorities) -- higher nice can make it use the entire CPU even when other apps are running, but it is still better to quit all other apps beforehand (the OS scheduler still runs them, it just interrupts HandBrake more rarely)

What you describe is similar to when another app is running alongside HandBrake, which I did experience (e.g. HandBrake drops to 15 fps when doing a few parallel instances of "yes > /dev/null"). A higher nice level for HandBrake should alleviate that. In your case though, restarting HB seems to fix it which is strange. Are you sure there was nothing else running? what does the System Monitor say in the Energy tab?

Your graph shows that the temperature was still slightly increasing overall. I wonder what the outcome would be with a longer encoding test. I'm adding that option to the MacOH tool.
 
Last edited:

laurihoefs

macrumors 6502a
Mar 1, 2013
793
23
You just reminded me that I didn't incorporate nice and ionice for HandBrake (cpu and i/o priorities) -- higher nice can make it use the entire CPU even when other apps are running, but it is still better to quit all other apps beforehand (the OS scheduler still runs them, it just interrupts HandBrake more rarely)

What you describe is similar to when another app is running alongside HandBrake, which I did experience (e.g. HandBrake drops to 15 fps when doing a few parallel instances of "yes > /dev/null"). A higher nice level for HandBrake should alleviate that. In your case though, restarting HB seems to fix it which is strange. Are you sure there was nothing else running? what does the System Monitor say in the Energy tab?

Nothing aside Safari and System Monitor was running, and no process was taking much CPU time. Even without them, after the system has been idle for a while, I'm still often getting 15fps on the first run, and 30fps for the on subsequent runs. Energy tab shows nothing alarming either.

I was suspecting, that something I'm running in the background (like iStat Menus, Pupil or gfxCardStatus) is causing the scheduler to assign lower priority to HandBrake. I'll have to try what effect closing those one by one has. But if this is not a common issue, I won't clutter this thread further trying to figure out a solution here :)

Your graph shows that the temperature was still slightly increasing overall. I wonder what the outcome would be with a longer encoding test. I'm adding that option to the MacOH tool.

It might be very useful to add an option to do a couple of encoding runs in a row.

During the roughly eight minutes it took to run the test, the fan speeds didn't exceed 3000rpm. I've noticed, that with longer runs the temperature steadily rises for a while, until the fans finally start really kicking in, stabilizing the temperature to a level a couple of degrees lower than the peak temperature. Seven minutes seems to not have been enough for that to happen.

I'll try editing the script to run a couple of encodes in a row, and see what effect it has. (edit: I'll have to try with a larger file. Out of five successive runs two or three always end up running at 15fps, giving the CPU time to cool. Not even nice helped.)

With the higher end models the fan ramp-up might happen much quicker though.
 
Last edited:

qnxor

macrumors member
Original poster
May 2, 2014
78
0
HandBrake by default starts with nice 19, which means extremely low cpu priority (high value means low priority, don't ask). Virtually all processes have a higher priority and will trump it. Try sudo ps -eo pid,user,nice,command to see all processes with their nice levels (3rd column), most should be 0.

Try sudo renice -10 -p `pgrep HandBrakeCLI` after HandBrake starts to bump its priority and watch to see if the reported realtime fps increases. Note that HandBrake alters its priority after it starts, so trying to start it using nice -n 0 HandBrakeCLI won't work. You have to "renice" it after it starts.

We should probably continue this discussion in another thread or email (see my signature), but this info might help others who try my tool.
 

qnxor

macrumors member
Original poster
May 2, 2014
78
0
v1.2 beta released

Hi all,

v1.2 beta released: https://github.com/qnxor/macoh (download ZIP link on right side).

Added GpuTest, Prime95, Longer x264, GPU switch to force the integrated Intel GPU or discrete Nvidia GPU, option to run and monitor your own test, many more command line options, etc. Full description on GitHub.

Try it and post your graphs here (don't forget your Mac and OS specs and ambient temperature, which is very important). Here are samples from the new tests:

Long x264 test (no throttle)
x264-long.png


Prime95 test (heavy throttle, expected)
prime95.png


3D GpuTest using the Nvidia GT 750M (no CPU throttle)
gputest-gt750m.png


3D GpuTest using the integrated Intel Iris Pro (throttle, lower freq throughout)
gputest-irispro.png


Laptops may or may not throttle in the x264 test. Mine did not.

I expect most laptops to throttle in Prime95 (especially those with high power CPUs denoted HQ or MQ, less so for those with ULV CPUs denoted U).

I also expected the CPU to throttle in the 3D test more when using the integrated Intel Iris Pro GPU than when using the Nvidia GPU. It is harder to cool a single hot surface (CPU + Intel Iris Pro) than two less hot surfaces (CPU + Nvidia). Things got better once fans hit full speed (temp decreased after hitting max, then frequency picked up too) but the frequency was still lower though than in the Nvidia case.

Curious to see results from others.

Cheers
 
Last edited:

Daniele Mnn

Cancelled
Jan 2, 2014
22
3

qnxor

macrumors member
Original poster
May 2, 2014
78
0
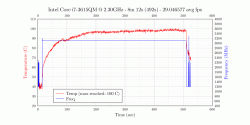
Daniele, your results are pretty good. The maximum freq of your CPU is 2.9 GHz and it does not throttle at all in the x264 test. Temperature also looks good there. In my opinion, the x264 test is the most representative of a demanding real-world CPU workload.

It throttles a little in Prime95, dropping to 2.6 GHz which it then maintains constant. That's a pretty good result. Prime95 is unrealistically stressful for any CPU -- you'd be hard pressed to find this level of stress elsewhere. I would have expected worse results, but your dual-core ULV CPU helps (the higher end chips like the quad-core i7-4850HQ have a much higher TDP).

The worst throttle is in the 3D test GpuTest. The maximum frequency was 2.5 GHz to begin with, which further dropped to 1.9 GHz but after your fan kicked in the drops were less severe (all subsequent dips are min 2.1 GHz). A bit disappointing for a ULV CPU like yours -- it means that 3D games will suffer -- but not exactly unexpected in my opinion since both CPU and GPU are stressed; in your case these are virtually on the same small die which makes it difficult to cool (see my own results and discussion in my post above on this matter). It's a price you pay for having a very slim and slick laptop.

The only bit that surprised me is your temperature at idle, about 51 C, especially since you say the ambient temp was 18C. That looks too high to me but I have not tested nor inspected the 13" model to tell whether that's expected. The maximum temp during tests looks normal though, so as long as your fans don't spin loudly when it's idle then I wouldn't worry.

Overall, I'd say you're doing pretty good.
 
Last edited:

Daniele Mnn

Cancelled
Jan 2, 2014
22
3
That "idle" temperature was after making the test, in reality it's lower with just one screen, with two screens and my normal apps, chrome and others, while doing everything it stays at 50° except games and similar stuff.
 

laurihoefs

macrumors 6502a
Mar 1, 2013
793
23
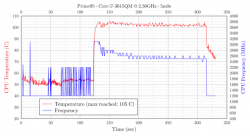
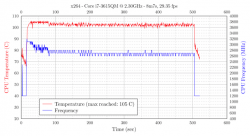
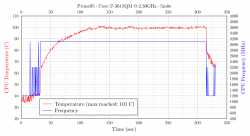
Attached are graphs from Mid-2012 rMBP base model, with the v1.2 beta script, ambient temperature ~20°C
 

Attachments

  • 20140512-112434-x264.png
    20140512-112434-x264.png
    63.4 KB · Views: 614
  • 20140512-112434-x264-long.png
    20140512-112434-x264-long.png
    65.9 KB · Views: 523
  • 20140512-112434-prime95.png
    20140512-112434-prime95.png
    64.4 KB · Views: 548
  • 20140512-112434-gputest.png
    20140512-112434-gputest.png
    87.9 KB · Views: 529
  • 20140512-190250-gputest.png
    20140512-190250-gputest.png
    87.3 KB · Views: 545
Last edited:

qnxor

macrumors member
Original poster
May 2, 2014
78
0
Those look quite good. 103C and still no throttle, impressive (yet not exactly healthy). I would have expected the QM CPU to throttle in Prime95 ... are you sure you used in-place FFTs and min=max=8K FFT size?

The 3D GpuTest graphs both seem to have used the integrated Intel card. Problems with gfxCardStatus? (there is a documented bug). It's also evident that in your case, 5 minutes is not conclusive for the 3D test. The temperature was still rising at the end. You could change the duration to 20 mins and retry.

If anyone knows of command line tools that can report fan RPM, GPU freq, GPU temp, please let me know.
 

Quackers

macrumors 68000
Sep 18, 2013
1,938
708
Manchester, UK
I too have run these tests on a 2012 rMBP running 10.9.2 build 13C1021 and my results look somewhat different :confused:
Ambient temp was originally about 15C.
Any thoughts or suggestions? Thanks (it's all a foreign language to me :D )
 

Attachments

  • 20140512-145514-gputest.png
    20140512-145514-gputest.png
    199.7 KB · Views: 539
  • 20140512-145514-prime95.png
    20140512-145514-prime95.png
    161.1 KB · Views: 581
  • 20140512-145514-x264.png
    20140512-145514-x264.png
    160.1 KB · Views: 602
Last edited:

qnxor

macrumors member
Original poster
May 2, 2014
78
0
@Quackers: That's quite some throttling. Throttling is when the CPU decreases the frequency in an attempt to lower power consumption to prevent overheating (which can otherwise permanently damage the chip). That is by design, but in your case it's quite severe and the temperature too high (105C), especially since the ambient temp was as low as 15C.

You can see the frequency (blue line) throttle (drop) quite a lot even in the x264 test, which should not cause so much throttle. Normally it should stay at a roughly constant value of 3.1 GHz for your CPU. The 3D test also shows the CPU dropping the frequency. It means that your laptop is underperforming when the workload increases by about 20% (3D games too, which I for one don't care about). @lauriheofs above has the same CPU as yours but his is working fine, slightly better than I would expect.

My guess is that either (a) your fans and/or vents have acquired dust, which affects the cooling efficiency, or (b) Apple applied too much thermal paste in your laptop, reducing the heat transfer from the cpu to the heatsink - Apple is known for that, especially in previous models (though they're not the only manufacturer who overdo it).

Thread about dust: https://forums.macrumors.com/threads/1597455/

Thread about heatsink and thermal paste (sometimes refered to as thermal compound or heatsink compound): https://forums.macrumors.com/threads/1573281/ ... see also video: http://youtu.be/LF0PBUnoNOc?t=9m55s

If it's under warranty, you could give it to Apple to fix. Otherwise, if the fans don't kick in often, or if you don't feel it's slow for the tasks you usually run, then you may just ignore the problem.

You could at the very least blow some air in the vents (in the back, but there may be vents on the sides too, like on the Late 2013 model). I recommend buying a can of compressed air and use that, they are created especially for this purpose: see here.

If it's out of warranty, you could gather the courage and open it up to clean the fans and vents properly. You can attempt to change the thermal paste too, like in the video, but only if you feel confident and have the tools and paste.

Anyway, I'm glad the MacOH script is doing its job (to reveal throttling/overheating) :)
 
Last edited:

Quackers

macrumors 68000
Sep 18, 2013
1,938
708
Manchester, UK
Thanks for your reply qnxor and for your guidance.

I started thinking about this problem because basic graphics performance (in Windows 8.1) was quite poor. I was unaware of any throttling in OSX. The only symptom I see is that sometimes after prolonged use of graphics intensive programs things would start to stutter a little.
I am not a gamer so this is nothing major to me, however it did get me thinking.

2 weeks ago I had a new screen fitted at Apple (I have Applecare) due to image retention. I also had a fan replaced as it was a little noisy.
I asked the tech to clean out the laptop if there was any sign of dust.
He said it was as clean as a whistle inside - so definitely not dust related.
I have heard about the thermal paste problem and I suspect mine is a candidate for that.
Basically I can live with it due to my lack of graphics-intensive software. I'm not sure I should have to though.

When the screen was replaced they ran the AHT and that showed nothing wrong, to my knowledge. Would a graphics gpu/heatsink problem show up in that test?

Once again, thanks for your input and your work in this field.
 

laurihoefs

macrumors 6502a
Mar 1, 2013
793
23
Those look quite good. 103C and still no throttle, impressive (yet not exactly healthy). I would have expected the QM CPU to throttle in Prime95 ... are you sure you used in-place FFTs and min=max=8K FFT size?

I'll check the settings and redo.

The 3D GpuTest graphs both seem to have used the integrated Intel card. Problems with gfxCardStatus? (there is a documented bug). It's also evident that in your case, 5 minutes is not conclusive for the 3D test. The temperature was still rising at the end. You could change the duration to 20 mins and retry.

That was actually just me attaching the wrong file. And already deleting the correct one. Duh... I'll redo that one too.


Edit: redid the tests, results attached. I'll change the GPU test graph from my earlier post too.

To my surprise, no throttling occurred in the Prime95 test. I see heavy throttling after about a minute of running the In-place large FFTs -preset, but with the custom settings, no throttling.
 

Attachments

  • 20140512-190250-prime95.png
    20140512-190250-prime95.png
    62 KB · Views: 540
  • 20140512-190250-gputest.png
    20140512-190250-gputest.png
    87.3 KB · Views: 530
Last edited:

qnxor

macrumors member
Original poster
May 2, 2014
78
0
@Quackers: No, the thermal paste issue would not show up during a screen replacement procedure. It's actually impossible to see unless you physically remove the heatsink (see the video). I suspect that is the culprit in your case.

Stuttering after a while is virtually always a result of too much (abnormal) throttling. Note that while my script shows CPU throttling, it does not show GPU throttling. Both the CPu and GPU, while different chips, they sit under the same heatsink and influence each other's temperature. They both throttle when pushed too hard or if the cooling system is inefficient. Your CPU throttles too much during the 3D test GpuTest that you ran, a test which does not really stress the CPU, so that massive CPU temperature increase and freq drop that you experienced are mostly the result of the GPU heating up next to it, under the same heatsink. I suspect your GPU also throttles (you mention it stutters after a while).

I'm still looking for a command line tool that can read the GPU freq and temperature so I can plot that as well during tests (there are tons of those for Windows, not so manyfor MacOS). You could then take it as evidence to Apple and have the replace the thermal paste. You may ask Apple to do that as it is, quoting that it begins to stutter after a while. Don't let them tell you it's normal (a lot of manufacturers get away with that). But then again, if you're not bothered, it may not be worth the hassle or your time.
 

qnxor

macrumors member
Original poster
May 2, 2014
78
0
Thanks again qnxor, that's some things for me to think about.

Indeed. One other thing: the temperature in your case shoots up way too quickly, almost instantly even in the x264 test (compare with @laurihoefs who has the same CPU). This is definitely a sign of bad cooling. More specifically, poor heat transfer from the CPU die to the heatsink. Bad thermal paste, too much thermal paste, bad heatsink-CPU contact etc ... I'm not surprised it throttles so much.

@laurihoefs: Indeed the "max heat" preset generates more heat, but I'm inclined to leave it. It's draconian already. When the Prime95 bug gets fixed (I may do it myself) so that I can start the torture test from command line then I can add options to start it with any parameters from the menu/cmd line.
 

Quackers

macrumors 68000
Sep 18, 2013
1,938
708
Manchester, UK
qnxor, I see what you mean.
As I said earlier I don't do any gaming nor anything really graphics intensive. Even so I noticed things weren't right.
I'm guessing that either the cpu or the gpu (possibly both) could be at risk in the future.
 

qnxor

macrumors member
Original poster
May 2, 2014
78
0
I'm still searching for a free tool that can monitor and log the GPU temp and freq to a file or stdout and works with the latest MBPs.

Anyone knows of such a tool?

@Quackers: Since the x264 test only stresses the CPU (the GPU is not loaded at all) then the CPU certainly has heat transfer issues. The GPU possibly has too - it's unlikely they did a great job for the GPU and a messy job for the CPU.

Bogdan.
 

Quackers

macrumors 68000
Sep 18, 2013
1,938
708
Manchester, UK
I'll speak to Applecare tomorrow and see what they say. Maybe I can show them the graph of the heat rise. That can't be right and I wouldn't have thought they'd be overjoyed about it either.
I'll see what they say.
Thanks again Bogdan.
 

adnbek

macrumors 68000
Oct 22, 2011
1,584
551
Montreal, Quebec
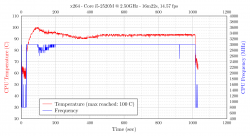
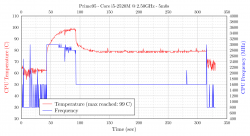
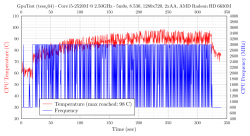
Mac Mini 2011 (2.5ghz with 6630m), ambient temp around 20c.

For Prime95, I put a checkmark for "Run FFTs in-place". Was that correct? (EDIT: Nevermind. Just read the Github page carefully.)

Not surprised by the results due to its tight enclosure. :p But I'd be curious to compare with other Mac Minis to see if it performs better or worse than the norm.
 

Attachments

  • 20140512-185148-x264.png
    20140512-185148-x264.png
    58 KB · Views: 654
  • 20140512-185148-prime95.png
    20140512-185148-prime95.png
    64.3 KB · Views: 505
  • 20140512-185148-gputest.png
    20140512-185148-gputest.png
    126.2 KB · Views: 492
Last edited:
Register on MacRumors! This sidebar will go away, and you'll see fewer ads.