That is exactly what I did in my post above. I used iStat menu while running the benchmark, or am I misunderstanding what you are asking ?Hi Guys! Awesome thread! Can someone post your Temperature using an app? GPU/CPU/Battery and so on! Just curios! I am testing mine and doing more MODS adding Thermal pads to almost all parts of the logic board that draws heat!
I would like to know what is your temp. Thank you
Got a tip for us?
Let us know
Become a MacRumors Supporter for $50/year with no ads, ability to filter front page stories, and private forums.
M1 Air with Thermal Pad Mod
- Thread starter downshiftdre
- Start date
- Sort by reaction score
You are using an out of date browser. It may not display this or other websites correctly.
You should upgrade or use an alternative browser.
You should upgrade or use an alternative browser.
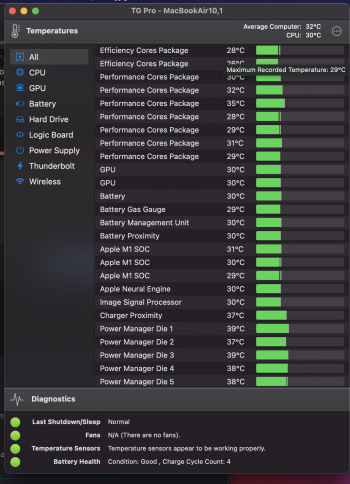
Hey Bro! What I meant is the whole temperature inside of your M1 Air! Like the Logic board, Power supply, wireless, SSD, all of it! Maybe a screen shot inside iStat or TGPro? Thank youThat is exactly what I did in my post above. I used iStat menu while running the benchmark, or am I misunderstanding what you are asking ?
Here is a screen shot of Macs Fan Control with all 15 temperature readings taken running Handbrake (all night and still running). These can be regarded as 'terminal' temperatures, i.e.they should not get any higher, ever. This is my base model 8GB/256GB M1 MBA with upper heatsink thermal pad and on a stand with the screen open (not in clamshell mode).

Thanks Man! Thanks for doing a screenshot of your M1's Internal Temperature! Were you running something when you did the screenshot? Temps kinda high for majority of the components... What's your Idle temp for all of those?Here is a screen shot of Macs Fan Control with all 15 temperature readings taken running Handbrake (all night and still running). These can be regarded as 'terminal' temperatures, i.e.they should not get any higher, ever. This is my base model 8GB/256GB M1 MBA with upper heatsink thermal pad and on a stand with the screen open (not in clamshell mode).
View attachment 1721301
That has given me pause for thought, I use TGPro, my GPU is constantly reported as 30 C, it never goes above that figure. Just wondering if there is some sort of bug in the reporting, or just coincidence.Here's mine while watching HD Youtube Video. Using TGPro!
A further 10 minute run this morning. This time I switched on the low speed 40mm cooling fan that is mounted under the tempered glass scales that I use as a laptop stand.
Highest reported temperatures at the end of the 6th run was 85 C for the main CPU and 35 C for the battery.
the scores after each individual run were:
7785, 7786, 7788, 7789, 7787, 7786
Curious to see that the score is a bit lower than yesterdays run without the fan.
Ambient temp was a bit lower on the latest test too
Here is the same thing not running HandBrake - just the usual browsing and email. The ambient temperature is 23.7.Thanks Man! Thanks for doing a screenshot of your M1's Internal Temperature! Were you running something when you did the screenshot? Temps kinda high for majority of the components... What's your Idle temp for all of those?
One last run,
A longish run to check stability.
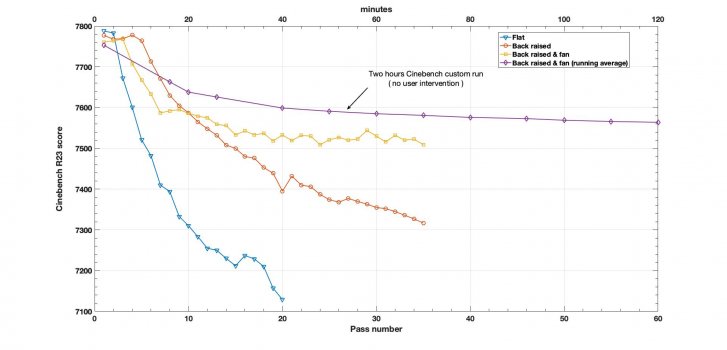
I ran a 2 hours custom Cinebench R23 test (no user intervention) to check the long term trend (running average) of the CB scores with the MBA thermal pad mod. I recorded the scores reported by Cinebench every few minutes, usually ten, but varied from time to time, since I left run the test unattended. I decided to do this custom, continues test since even a slight cooling period (a few seconds that may result from manually starting each individual pass) is enough to cool a bit the cpu and increase the MBA performance. For example I ran a single pass just when the 2 hours test had finished (took me a few seconds - less than five - to change the test settings) and the score was 100 points higher than the obtained from the 2 hrs test.
The laptop is seated over an aluminium stand and a small cpu fan blows air at the bottom of the laptop. The aluminium stand has five slots to facilitate heat dissipation, thus some of the air forced by the fan should reach directly the MBA bottom case. Results of the test are in the attached figure, jointly with previous results (from individual, consecutive passes) with the pad mod under slightly different conditions.
As can be seen in the attached figure, even for very long periods of sustained, high cpu usage only a 3% decrease in performance is incurred, if the mod and a bit of extra cooling is added. Thus if you need extra performance, for long periods of time for a few quids (just £5 in my case - I already had the laptop stand and the fan was from a discarded one from an old computer) you can achieve sustained high performance. Without the mod my MBA was bottoming at around 6300 CB points after the 10 min test. We are of course counting on the fact that the machine will self protect, if the temperature of any critical components exceeds a predeterminate threshold, set during manufacturing.
Have a good mod everyone.
Attachments
DrDVil,
Good testing methodology! I concur that the CPU temp varies up or down hugely within a second or so of high or low load. Those running a 10 min CB test then starting another one manually will get quite different results to a longer continuous test.
I agree, one must put one's faith in Apple in keeping the critical components at a suitable temperature under heavy load. However, I am working my MBA flat-out in compressing a year's worth of Blu-ray and DVD films non-stop as a very thorough stress-test while it is still in warranty! When I did this with my 25Kg 2008 Mac Pro, I did not need any heating even mid-winter and I couldn't hear anyone knock on the door. The drastic increase in speed, the silence and the incredibly low power seem like 'alien technology' in comparison. I can now run my MBA from a small USB solar panel!
As an amateur sound engineer, the lack of fan transforms the way a recording studio needs to be. There is no longer a need for a separate room for the recording engineer and gubbings. The loudest noise is likely to be a bird or insect outside the window.
A fan-less, fast laptop is an immense luxury so I won't be using a fan with mine any time soon. Let the birds and the insects be the noise floor - whether recording or not.
As you can see in my test, just raising the back of the MBA (maybe the front also) is just enough to increase the sustained performance! So, with no fan, you can hear the birds chirping while you transcode like if there were no futureDrDVil,
Good testing methodology! I concur that the CPU temp varies up or down hugely within a second or so of high or low load. Those running a 10 min CB test then starting another one manually will get quite different results to a longer continuous test.
I agree, one must put one's faith in Apple in keeping the critical components at a suitable temperature under heavy load. However, I am working my MBA flat-out in compressing a year's worth of Blu-ray and DVD films non-stop as a very thorough stress-test while it is still in warranty! When I did this with my 25Kg 2008 Mac Pro, I did not need any heating even mid-winter and I couldn't hear anyone knock on the door. The drastic increase in speed, the silence and the incredibly low power seem like 'alien technology' in comparison. I can now run my MBA from a small USB solar panel!
As an amateur sound engineer, the lack of fan transforms the way a recording studio needs to be. There is no longer a need for a separate room for the recording engineer and gubbings. The loudest noise is likely to be a bird or insect outside the window.
A fan-less, fast laptop is an immense luxury so I won't be using a fan with mine any time soon. Let the birds and the insects be the noise floor - whether recording or not.
Enjoy your machine!
Last edited:
As @timmillea said, excellent methodology and I think this just about settles the benchmark for what is possible with this excellent machine.One last run,
A longish run to check stability.
I ran a 2 hours custom Cinebench R23 test (no user intervention) to check the long term trend (running average) of the CB scores with the MBA thermal pad mod. I recorded the scores reported by Cinebench every few minutes, usually ten, but varied from time to time, since I left run the test unattended. I decided to do this custom, continues test since even a slight cooling period (a few seconds that may result from manually starting each individual pass) is enough to cool a bit the cpu and increase the MBA performance. For example I ran a single pass just when the 2 hours test had finished (took me a few seconds - less than five - to change the test settings) and the score was 100 points higher than the obtained from the 2 hrs test.
The laptop is seated over an aluminium stand and a small cpu fan blows air at the bottom of the laptop. The aluminium stand has five slots to facilitate heat dissipation, thus some of the air forced by the fan should reach directly the MBA bottom case. Results of the test are in the attached figure, jointly with previous results (from individual, consecutive passes) with the pad mod under slightly different conditions.
As can be seen in the attached figure, even for very long periods of sustained, high cpu usage only a 3% decrease in performance is incurred, if the mod and a bit of extra cooling is added. Thus if you need extra performance, for long periods of time for a few quids (just £5 in my case - I already had the laptop stand and the fan was from a discarded one from an old computer) you can achieve sustained high performance. Without the mod my MBA was bottoming at around 6300 CB points after the 10 min test. We are of course counting on the fact that the machine will self protect, if the temperature of any critical components exceeds a predeterminate threshold, set during manufacturing.
Have a good mod everyone.
These posts popped up just as I was composing my post. This morning I ran two back to back CB23 ten minute tests. Again, just as timmi says, the temperature drops rapidly in just a few seconds. I made a note at the end of each run, the duration of each individual run is slightly under two minutes so the test runs a few seconds over the ten minutes in order to complete the sixth run.
The processor temperature was 70 C after the first run, this rose steadily with the final four runs maxing out at 90 C and this is where the scores started to fall away. The Battery started at 23 C and finished at 40 C
Anyway, numbers for the 2 x 10 minute back to back runs, I'll just give the processor scores from the end of each of the 12 individual runs:
7786, 7787, 7784, 7780, 7781, 7783, 7781, 7772, 7739, 7708, 7683, 7663
The final, final test 
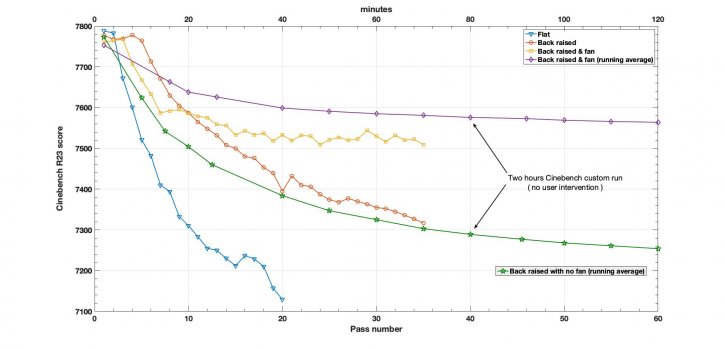
I was curios about how much of a difference makes the external fan over a long run. Im including in the attached figure the results for the CB 2hrs custom test with no fan.
As can bee seen in the figure, compared to peak performance, the average drop with the mod an external fan is just 2.4%, in average for the 2hrs period, while without the fan is 6.7%. So the fan makes a difference, but only is relevant for very long runs. For example, for 2hrs and no fan it would take 5 mins more to complete the same task than with fan, so no big deal. But for a day it will be 1 extra hr. So it's relevant but only for very long usage.
By the way, the fan that I'm using is very silent, so is not really a noisy solution for situations where you need that extra bit of performance.
Have a good mod.
Cheers
Attachments
Many thanks for this, excellent work. I've bought you a virtual pint as a well deserved reward 🍺The final, final test
I was curios about how much of a difference makes the external fan over a long run. Im including in the attached figure the results for the CB 2hrs custom test with no fan.
As can bee seen in the figure, compared to peak performance, the average drop with the mod an external fan is just 2.4%, in average for the 2hrs period, while without the fan is 6.7%. So the fan makes a difference, but only is relevant for very long runs. For example, for 2hrs and no fan it would take 5 mins more to complete the same task than with fan, so no big deal. But for a day it will be 1 extra hr. So it's relevant but only for very long usage.
By the way, the fan that I'm using is very silent, so is not really a noisy solution for situations where you need that extra bit of performance.
Have a good mod.
Cheers
So I received my shipment of 100mm x 100mm x 2mm thermal pad today, and decided to try it out in my MBA 8c 16GB/1TB.
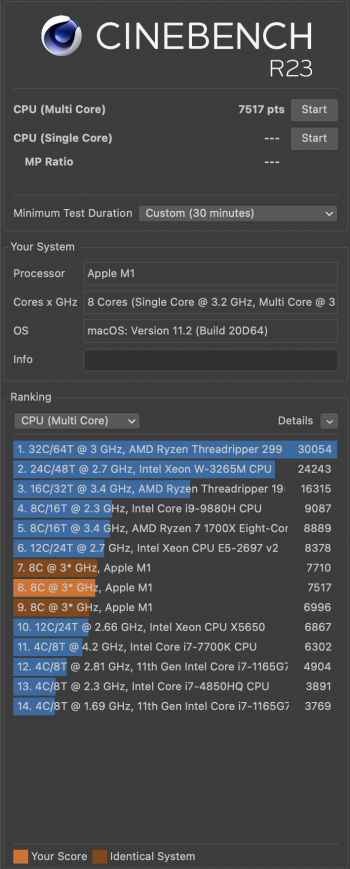
First off, I updated to the latest MacOS, 11.2 (20D64) then ran a multi-core Cinebench R23 test for baseline. I got a score of 6996 which is pretty comparable to my attempts before. The throttling of the MBA is pretty well documented so I didn't bother running the test for longer and proceeded to open up the case to get started. Opening the bottom revealed that I too have the pad of ~3mm thermal foam over the more recessed portion of the heatsink that has been described elsewhere in this thread. It has been speculated that this might have been added to later production MBAs, but I bought mine on launch day and it was manufactured on 02/11/2020 so if it is production date related they must have made the change pretty quickly.
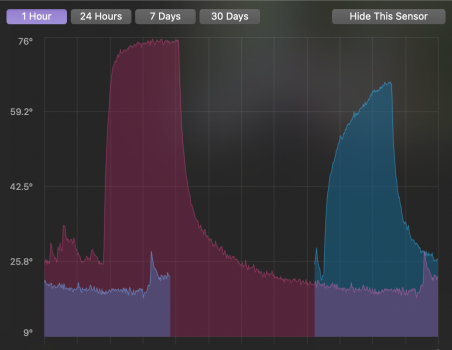
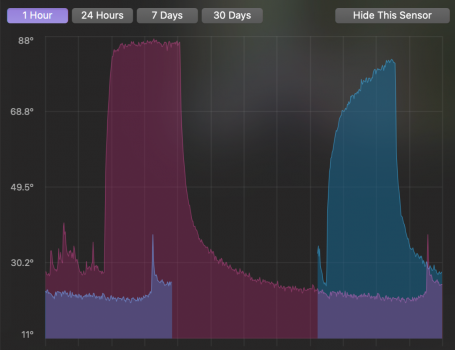
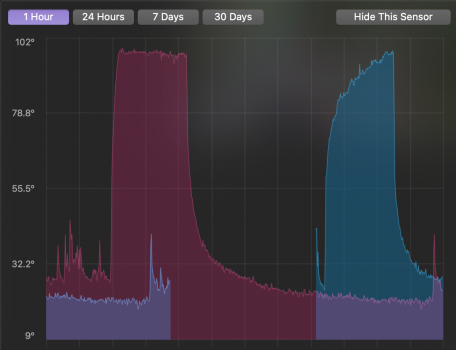
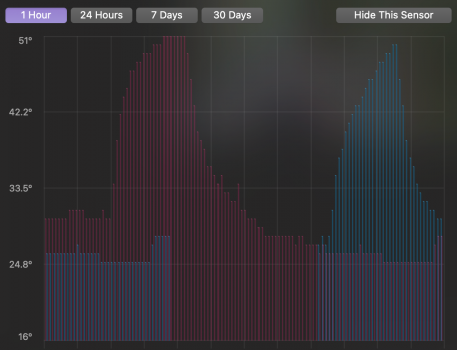
I installed the thermal pad on the same 2mm portion of the heatsink that a few others in this thread have done without modding or removing anything, closed up the case and began to run test again. I first ran the same Cinebench test as before and scored a 7710! Both tests were done in the same room (ambient temp between 19.5-20 C) on a standard, enamel painted MDF table. I then ran Cinebench for longer, setting a 30 minute custom test duration, ending with a score of 7517 (you can see the three test results in the attached image).
As for temperatures, attached are four graphs from iStat Menus which I outputted then overlaid. Each file is labelled for its sensor, the first two are SOC MTR 0 and SOC MTR 2, then the pACC MTR 3 (hottest of the performance cores on my system), then for something outside the SOC I also attached the SSD sensor. For each graph the earlier pre-mod test results are in red, the post-mod results are in blue. All four seem to show a very different curve and lower peak temperatures, which would suggest that along with the higher Cinebench score I think the mod is pretty much a home run thus far!
Attachments
I wonder if the sponge is to do with the number of cores. My base spec is 8/7 core so perhaps the sponge helps differentiate the performance between the 8/7 and the 8/8. ( the Cinebench R 23 scores on my base 8/7 256 are always in the high 7700's, I ran a quick test half an hour ago and got 7794 )Opening the bottom revealed that I too have the pad of ~3mm thermal foam over the more recessed portion of the heatsink that has been described elsewhere in this thread. It has been speculated that this might have been added to later production MBAs, but I bought mine on launch day and it was manufactured on 02/11/2020 so if it is production date related they must have made the change pretty quickly.
Haha, Ninja'd by Timmillea 😁It appears Apple's own thermal foam is only installed in the higher-spec MBA models. One could suspect it is a deliberate little touch to add some performance gains to the more expensive models. The thermal pad mod levels the field I think.
Interesting thought, or perhaps it could be that the 8/8 config was deemed to perform better with the thermal foam/sponge because of the extra GPU core?
I admit that my initial 6996 score seems low for my config, I do wonder if I should have tried running it a few times to get an average. Either way, I’m quite happy with the better thermals, it seems to run on average a couple degrees cooler and also takes longer to reach peak temperature, both of which are nice bonuses from what amounted to a 5 minute mod.
I admit that my initial 6996 score seems low for my config, I do wonder if I should have tried running it a few times to get an average. Either way, I’m quite happy with the better thermals, it seems to run on average a couple degrees cooler and also takes longer to reach peak temperature, both of which are nice bonuses from what amounted to a 5 minute mod.
Noticed this prominent tech YouTuber (Linus Tech Tips) just posted that they essentially did this same mod on the MBA and achieved similar results:
Those snazzy videos still fail to cover the essential - sustained performance! As explained, CineBench scores are a running average and are not a good indicator of steady-state performance after throttling back. A 10 minute CineBench test is an especially useless indicator of sustained performance. So I de-average a custom 60 minute (minimum) CB r23 test to calculate the per pass performance using the formula:
(latest score x total duration so far - previous score x total duration to its scoring) / duration of last pass
This yields exactly what we want - the CineBench score of just the last pass. After running for an hour, it is a very good indicator of continuous, steady-state, maximum load performance. But remember, this is a big ask for a fan-less little laptop!
I felt a little guilty in post #107 of showing battery temperatures per pass instead of strictly by time. Most charts are showing per pass quasi-units of time instead of strict linear time. This tends to skew them towards the earlier, faster passes. By way of redeeming myself, here are my updated charts in linear time!
Just a reminder that my MBA is the base model 8GB/256GB 8/7 model and I did the most minimalistic of mods - a low-spec (2 W/m.k) 2mm thermal pad (£2.39) over the higher part of the heatsink only. However, I had to splurge on a P5 'pentalobe' screwdriver (£4.80). Here are its inerds post-mod.

First de-averaged, per-pass CB R23 performance. This is three charts in one: pre-mod, post mod and post mod on a Griffin laptop stand like this.

This ensures a good degree of passive air cooling of the lower case. I bought it years ago to use a laptop with my wireless keyboard and trackpad at a better working height - it splits in three so is highly portable.
Ambient room temperatures were in the range of 20.2 - 22 degrees C.

Please ignore the plateau on the 'Mod plus stand' line - I had to take the dog out urgently during the test so couldn't record the numbers briefly. You can mentally fill-in the curve.
In all three cases, you can see maximum thermal throttling-back occurs well into the second half-hour of the continuous run and then the performance bounces around within limits. In all three, I think it is reasonable to call the final pass score as representative of the steady-state sustained performance.
Pre-mod: 6332
Post-mod: 6902 (+9.00% cf. pre-mod)
Post mod + stand: 7386 (+16.65% cf. pre-mod)
These figures are not comparable to regular CineBench scores as the latter are averaged over the entire test and hence will only approach these final sustained scores (but never actually reach them) after a very long time.
However, just for reference, here is the chart of the same tests but not de-averaged, ie. just as reported by CineBench after each pass but still shown linear with time. Again shown over 61 minutes of continuous CB testing. Excuse the dog leg again.

And the reason why it is reasonable to say this is 'steady state' is because of the battery temperature, proxy for the temperature of all the internal components, bar the CPU (which reaches 92-93 degrees within seconds and stays there under load) is also steady-state by the end of the hour test. Here is the chart. This is now in linear time (rather than per pass as per my previous post) and continues to 80 minutes showing the cooling down after the CB 60 minutes (min) tests.
The end points of the test, and hence the start of the cooling, are slightly different as CB finishes its final pass after the minimum (60 mins) stipulated time.

Again forgive the dog-toilet jump in the Mod + Stand line.
Clearly the stand does a great job of allowing the lower case to disperse its heat and hence letting the MBA run faster for that near 17% sustained performance increase.
To put it bluntly, that is one hour saved every six, forever.
Tim (no snazzy video and no commissioned purchase links).
(latest score x total duration so far - previous score x total duration to its scoring) / duration of last pass
This yields exactly what we want - the CineBench score of just the last pass. After running for an hour, it is a very good indicator of continuous, steady-state, maximum load performance. But remember, this is a big ask for a fan-less little laptop!
I felt a little guilty in post #107 of showing battery temperatures per pass instead of strictly by time. Most charts are showing per pass quasi-units of time instead of strict linear time. This tends to skew them towards the earlier, faster passes. By way of redeeming myself, here are my updated charts in linear time!
Just a reminder that my MBA is the base model 8GB/256GB 8/7 model and I did the most minimalistic of mods - a low-spec (2 W/m.k) 2mm thermal pad (£2.39) over the higher part of the heatsink only. However, I had to splurge on a P5 'pentalobe' screwdriver (£4.80). Here are its inerds post-mod.
First de-averaged, per-pass CB R23 performance. This is three charts in one: pre-mod, post mod and post mod on a Griffin laptop stand like this.
This ensures a good degree of passive air cooling of the lower case. I bought it years ago to use a laptop with my wireless keyboard and trackpad at a better working height - it splits in three so is highly portable.
Ambient room temperatures were in the range of 20.2 - 22 degrees C.
Please ignore the plateau on the 'Mod plus stand' line - I had to take the dog out urgently during the test so couldn't record the numbers briefly. You can mentally fill-in the curve.
In all three cases, you can see maximum thermal throttling-back occurs well into the second half-hour of the continuous run and then the performance bounces around within limits. In all three, I think it is reasonable to call the final pass score as representative of the steady-state sustained performance.
Pre-mod: 6332
Post-mod: 6902 (+9.00% cf. pre-mod)
Post mod + stand: 7386 (+16.65% cf. pre-mod)
These figures are not comparable to regular CineBench scores as the latter are averaged over the entire test and hence will only approach these final sustained scores (but never actually reach them) after a very long time.
However, just for reference, here is the chart of the same tests but not de-averaged, ie. just as reported by CineBench after each pass but still shown linear with time. Again shown over 61 minutes of continuous CB testing. Excuse the dog leg again.
And the reason why it is reasonable to say this is 'steady state' is because of the battery temperature, proxy for the temperature of all the internal components, bar the CPU (which reaches 92-93 degrees within seconds and stays there under load) is also steady-state by the end of the hour test. Here is the chart. This is now in linear time (rather than per pass as per my previous post) and continues to 80 minutes showing the cooling down after the CB 60 minutes (min) tests.
The end points of the test, and hence the start of the cooling, are slightly different as CB finishes its final pass after the minimum (60 mins) stipulated time.
Again forgive the dog-toilet jump in the Mod + Stand line.
Clearly the stand does a great job of allowing the lower case to disperse its heat and hence letting the MBA run faster for that near 17% sustained performance increase.
To put it bluntly, that is one hour saved every six, forever.
Tim (no snazzy video and no commissioned purchase links).
Last edited:
The good thing about the stand is that you have further gains with a passive solution, and you can use whatever you have at hand to raise your laptop. So no further investment may be required, just be sure (if you stand is not metallic) not to block your MBA base 
In my last tests I added the fan just to check the 'ultimate' performance gains with out spending an extra penny The fan that I added was a 12V, 12cm akasa viper (which I had no use for) and a discarded 9V power supply. I didn't have a 12V supply at hand so maybe there are further untapped gains, but at 9V the fan is almost silent.
Regarding the CB scores, if you test is long enough the running average will approaches the steady state performance. So I think that the CB score after a 2hrs test that I reported in may previous post may be a good indicator of the mod performance gains.
Cheers and have a good mod!
In my last tests I added the fan just to check the 'ultimate' performance gains with out spending an extra penny
Regarding the CB scores, if you test is long enough the running average will approaches the steady state performance. So I think that the CB score after a 2hrs test that I reported in may previous post may be a good indicator of the mod performance gains.
Cheers and have a good mod!
Hi Tim,Those snazzy videos still fail to cover the essential - sustained performance! As explained, CineBench scores are a running average and are not a good indicator of steady-state performance after throttling back. A 10 minute CineBench test is an especially useless indicator of sustained performance. So I de-average a custom 60 minute (minimum) CB r23 test to calculate the per pass performance using the formula:
(latest score x total duration so far - previous score x total duration to its scoring) / duration of last pass
This yields exactly what we want - the CineBench score of just the last pass. After running for an hour, it is a very good indicator of continuous, steady-state, maximum load performance. But remember, this is a big ask for a fan-less little laptop!
I felt a little guilty in post #107 of showing battery temperatures per pass instead of strictly by time. Most charts are showing per pass quasi-units of time instead of strict linear time. This tends to skew them towards the earlier, faster passes. By way of redeeming myself, here are my updated charts in linear time!
Just a reminder that my MBA is the base model 8GB/256GB 8/7 model and I did the most minimalistic of mods - a low-spec (2 W/m.k) 2mm thermal pad (£2.39) over the higher part of the heatsink only. However, I had to splurge on a P5 'pentalobe' screwdriver (£4.80). Here are its inerds post-mod.
View attachment 1725894
First de-averaged, per-pass CB R23 performance. This is three charts in one: pre-mod, post mod and post mod on a Griffin laptop stand like this.
View attachment 1725895
This ensures a good degree of passive air cooling of the lower case. I bought it years ago to use a laptop with my wireless keyboard and trackpad at a better working height - it splits in three so is highly portable.
Ambient room temperatures were in the range of 20.2 - 22 degrees C.
View attachment 1725896
Please ignore the plateau on the 'Mod plus stand' line - I had to take the dog out urgently during the test so couldn't record the numbers briefly. You can mentally fill-in the curve.
In all three cases, you can see maximum thermal throttling-back occurs well into the second half-hour of the continuous run and then the performance bounces around within limits. In all three, I think it is reasonable to call the final pass score as representative of the steady-state sustained performance.
Pre-mod: 6332
Post-mod: 6902 (+9.00% cf. pre-mod)
Post mod + stand: 7386 (+16.65% cf. pre-mod)
These figures are not comparable to regular CineBench scores as the latter are averaged over the entire test and hence will only approach these final sustained scores (but never actually reach them) after a very long time.
However, just for reference, here is the chart of the same tests but not de-averaged, ie. just as reported by CineBench after each pass but still shown linear with time. Again shown over 61 minutes of continuous CB testing. Excuse the dog leg again.
View attachment 1725913
And the reason why it is reasonable to say this is 'steady state' is because of the battery temperature, proxy for the temperature of all the internal components, bar the CPU (which reaches 92-93 degrees within seconds and stays there under load) is also steady-state by the end of the hour test. Here is the chart. This is now in linear time (rather than per pass as per my previous post) and continues to 80 minutes showing the cooling down after the CB 60 minutes (min) tests.
The end points of the test, and hence the start of the cooling, are slightly different as CB finishes its final pass after the minimum (60 mins) stipulated time.
View attachment 1725899
Again forgive the dog-toilet jump in the Mod + Stand line.
Clearly the stand does a great job of allowing the lower case to disperse its heat and hence letting the MBA run faster for that near 17% sustained performance increase.
To put it bluntly, that is one hour saved every six, forever.
Tim (no snazzy video and no commissioned purchase links).
Thanks once again for this, outstanding work, and a real benefit and go to reference for both us fellow "modders", and anyone thinking of taking the plunge. I wonder if your post could be made a "Sticky" ?
I did buy an aluminium laptop stand from Amazon, one of those adjustable ones. It was far too unwieldy and required a lot of strength to make any adjustment so it went back. I did have a thought when I saw the photo of your stand, the anti slip strips on the arms of the support act as a form of insulation, if it were bare metal then there would be greater thermal mass for the heat to travel into. ( I know the difference would probably be negligible as the stand would eventually reach equilibrium too )
My version of that Griffin stand does not have the little transparent stops at the end of the arms. In the old days of a revolving disk MacBook, the vibration was just enough, over a period of unsupervised hours, for the MacBook to slide off the stand. I assume they have added those stops because of this. So, then the rubber was absolutely essential in normal use.I did have a thought when I saw the photo of your stand, the anti slip strips on the arms of the support act as a form of insulation, if it were bare metal then there would be greater thermal mass for the heat to travel into.
To address the question, if you were a purist for performance, yes remove the rubber strips from this sort of stand. My thoughts are that 1) I only remove the bottom part of the protective shell case of my MBA to dissipate heat on the stand for a serious sustained load. If it is metal to metal there will inevitably be scratches on the bottom case in time; 2) the re-sale value depends upon physical external condition and the better I look after this MBA the more I have to put towards the next amazing machine in a few years from now, hence the less this machine actually costs me.
If I had had tons of money to spare, like those video freaks above, I would have gone for the very top-spec MBA (still not the MBP) and dispensed with all the difficulties of keeping it pristine for resale. If you have ever looked at ex-pro used equipment of any sort you will know what I mean.
I know the difference would probably be negligible as the stand would eventually reach equilibrium too
Yes, even with the mod, the heat is quite localised to where the pad meets the bottom case. The bottom case was never designed as a heatsink and is not great as one. Tinkering around the edges is, well, tinkering around the edges
Last edited:
Register on MacRumors! This sidebar will go away, and you'll see fewer ads.


