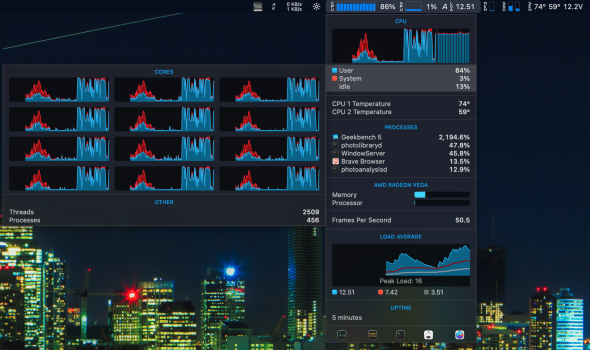
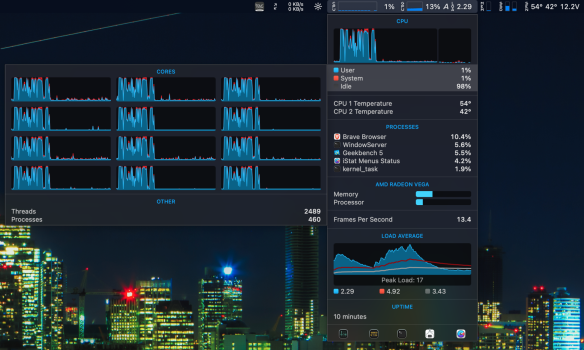
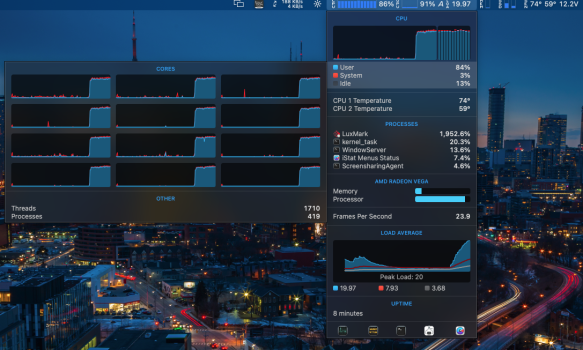
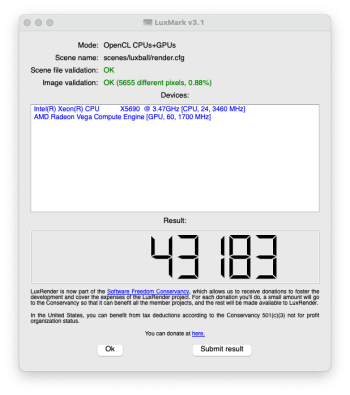
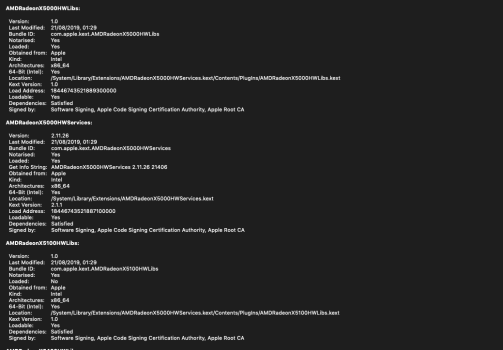
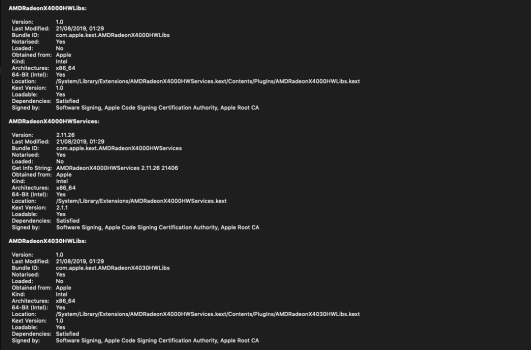
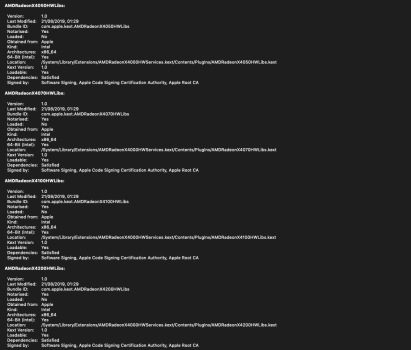
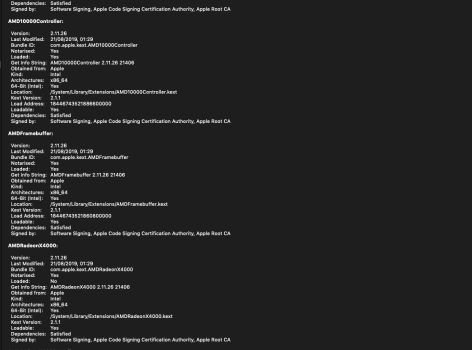
So what do I do about that, or how do I figure that out for sure?From that screen capture only, it looks like your cMP was using hardware encoding, but still too slow. Therefore the GPU loading is low, the CPU loading is also low. Only the GPU's media engine is working hard. However, the media engine's utilisation doesn't count as GPU loading. Therefore, you can't see it.
May I know what's the actual performance difference between your cMP and iMac to export the same timeline?
Anyway, 257% CPU loading in FCP can mean single thread limiting.
Single thread limiting doesn't mean "only one CPU core is doing the job", but "the job can only be done by one thread at a time".
Which means, if you have a 10 threads CPU, and each CPU core only has 10Hz. And Thread 1 does the 1st step, Thread 2 doesn the 2nd step, Thread 3 does the 3rd step.....
After 1 second, Activity monitor will show you the CPU is at 100% loading only (in macOS, for a 10 threads CPU, it can max at 1000%. So, 100% is very low). And each thread only has 10% loading.
However, due to thread 2 cannot to step 2 until thread 1 finish its job. And thread 3 cannot start to do the job until thread 2 finish the calculation...
Therefore, even each core only has 10% load. It is single thread performance limiting.
Since the CPU has internal logic to balance the work load (to balance the heat produced between cores). Therefore, the more cores you have, the harder you can see if that's really single thread limiting.
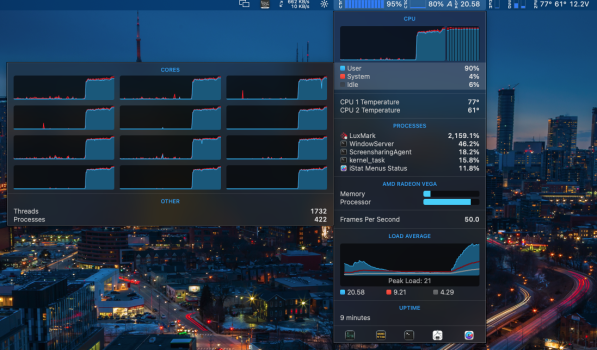
P.S. Just installed your OC package on my Mojave boot, it was slow af (Mojave). But then threw in my Monterey install, and using your OC, picked the Monterey install and booted, still getting similar usage in iStat. Even tried exporting with Compressor. Same thing.


