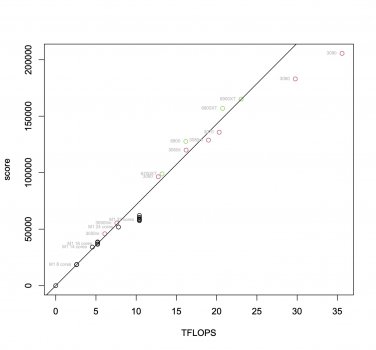
It'd be useful to have a plot showing the geekbench compute score as a function of FLOPS, for Apple Silicon, AMD 6XXX and Nvidia 3XXX.
Maybe I'll do it when I have the time. The challenge is finding reliable results, excluding overclocked GPUs and such. I think the ranking page shows average scores rather than median scores, which is not ideal.
If you just plot everything, put layers will be clearly visible. The real issue is getting the FLOPSs, since there are multiple variants of GPUs with different clocks etc. Not that it's a hard problem, but a tedious and boring one.
I’ve been looking at this. Unfortunately the some of more recent Desktop GPUs are too big to do a meaningful Perf/TFlop comparison with Apple’s, the laptop GPUs vary too much in terms of what they are actually rated at, different brands and different generations within a brand can have different scores wrt TFLOPS, and even beyond all this the ranking page can sometimes have very odd results for the same GPU (even beyond seemingly different clocks). So a big graph just pulling all the numbers down might just lead to noise.
Given all this, doing the best I can, I compared 3090 to the 3060 TI and the 2070 Super and 2060 in my last posts
here and
here. For the 2070 Super and 2060, GB scores increased linearly with TFlops for both OpenCL and CUDA. But this does break down when going from the 3060 TI to the 3090 - less so for CUDA - but the 3060 TI desktop GPU starts at a higher TFLOP than the M1Max.
For AMD, they get much lower absolute OpenCL scores per TFLOP compared to Nvidia, something
@leman mentioned, but again the increase in perf relative to two AMD GPUs, Pro Vega II and Pro Vega 56, is sort of linear wrt to their stated TFLOPS depending on which numbers you believe.
OpenCL
| ATI Radeon Pro Vega II Compute Engine (14.09 TFLOPs) | 81785 | |
| ATI Radeon Pro Vega 56 Compute Engine (8.96 TFLOPs) | 55927 |
Ratio of Perf to TFlops: 0.93
There were multiple entries for each with ratios ranging from 0.85 (bad but still better than M1) to 0.97 (near perfect), this *seemed* the best average for OpenCl and dovetailed with Metal scores below .
Metal
| AMD Radeon Pro Vega II | 101649 |
| AMD Radeon Pro Vega56 | 69229 |
Ratio of Perf to TFlops: 0.93
So GB doesn't scale over TFlops for AMD GPUs quite as linearly as for Nvidia chips ... but still better than the M1 to M1Max and even scales pretty linearly over Metal! Now could the lack of linear scaling in to the M1Max in GB wrt TFLOPs still be an interaction between GB, Metal, and the M1Max? Yup. But that's we're down to beyond GPU throttling and/or lower peak clocks to be alleviated/raised by high performance mode.


