One of the working theories is that the problem relates to swap usage, most apps that write log files shouldn't make much difference.I have now disable these 2 apps and not letting them run anymore (I read above there was someone talking about those apps writing logs file could be the reason why the crazy read / written?)
Got a tip for us?
Let us know
Become a MacRumors Supporter for $50/year with no ads, ability to filter front page stories, and private forums.
ssd swap - high usage of Terabytes Written
- Thread starter Forti
- WikiPost WikiPost
- Start date
- Sort by reaction score
You are using an out of date browser. It may not display this or other websites correctly.
You should upgrade or use an alternative browser.
You should upgrade or use an alternative browser.
- Status
- The first post of this thread is a WikiPost and can be edited by anyone with the appropiate permissions. Your edits will be public.
whoa, this is weird. from this Im getting:I've heard a few people mention possibly bugged tools. To likely rule that out, what are all of you getting from iostat?
iostat -Id disk0
Code:
disk0
KB/t xfrs   MB
15.29 222141 3318.01
Code:
Data Units Written: 1,953,022 [999 GB]those are two totally different numbers. which one should I believe? and what actually the iostat shows?
those are two totally different numbers. which one should I believe? and what actually the iostat shows?
man iostat
I think the difference is duration. SMART is lifetime while iostat is uptime.
man iostat
I think the difference is duration. SMART is lifetime vs iostat uptime.
I read somewhere that iostat viewed drive lifetime stats. That could be wrong though.
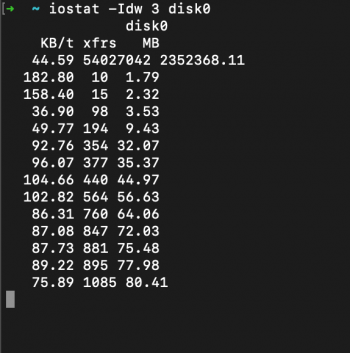
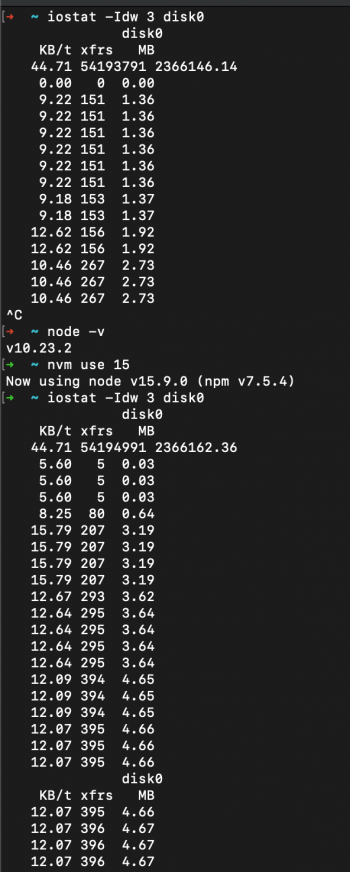
iostat shows current statistics. If you try `iostat -Idw 3 disk0` it will print the total uptime stats, and then every 3 seconds the stats for that time period (MB appears to be cumulative).I read somewhere that iostat viewed drive lifetime stats. That could be wrong though.
I read somewhere that iostat viewed drive lifetime stats. That could be wrong though.
I rebooted and it dropped so iostat is based on uptime.
Welp. My bad then.iostat shows current statistics. If you try `iostat -Idw 3 disk0` it will print the total uptime stats, and then every 3 seconds the stats for that time period (MB appears to be cumulative).
Is there a command for drive writes that doesn't involve 3rd party software?
iostat shows current statistics. If you try `iostat -Idw 3 disk0` it will print the total uptime stats, and then every 3 seconds the stats for that time period (MB appears to be cumulative).
I just ran the command and don't touch my computer for a few seconds. This can me very helpful
")
Attachments
that's almost twice as much as I have on the M1 Pro (same config), and last 6 hours of working got me 20GB extra, not even near 300GB.Code:disk0 KB/t xfrs MB 44.56 52170934 2270206.28
Code:Available Spare: 100% Available Spare Threshold: 99% Percentage Used: 0% Data Units Read: 7,219,728 [3.69 TB] Data Units Written: 5,803,539 [2.97 TB] Host Read Commands: 102,276,031 Host Write Commands: 38,831,905 Controller Busy Time: 0 Power Cycles: 69 Power On Hours: 44
Today is 16th day of using Mac mini m1 16/256. 3TB may not be much, but like I said many times before - it's growing ~~300 GB per day, and Macbook i5/16/256 has 47.5 TBW after 2 years and 3-4 months
Both machines to the same job, same tasks, same programs. Intel MacBook is running with BigSur for couple of months now (I was using beta for at least 3-4 moths)
I am sleeping or shutting it down over night tho. (Either logout-sleep or shutdown).
If i don't do logout when sleeping, it wakes up every hour or two (despite having PowerNap disabled)
Is there a command for drive writes that doesn't involve 3rd party software?
Homebrew is just a package manager. Grab the source to smartmontools, reverse engineer and write your own if you don't trust something that's standard across multiple OS'.
https://github.com/Homebrew/homebrew-core/blob/HEAD/Formula/smartmontools.rb
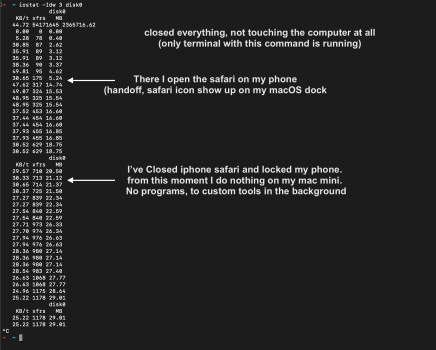
Guys, a few things from me. Check it out. I don't know what to think about that, yet.
Start with the one with red text.
MB = total number of megabytes transferred
so I suppose it's write and read, right?
Start with the one with red text.
MB = total number of megabytes transferred
so I suppose it's write and read, right?
Attachments
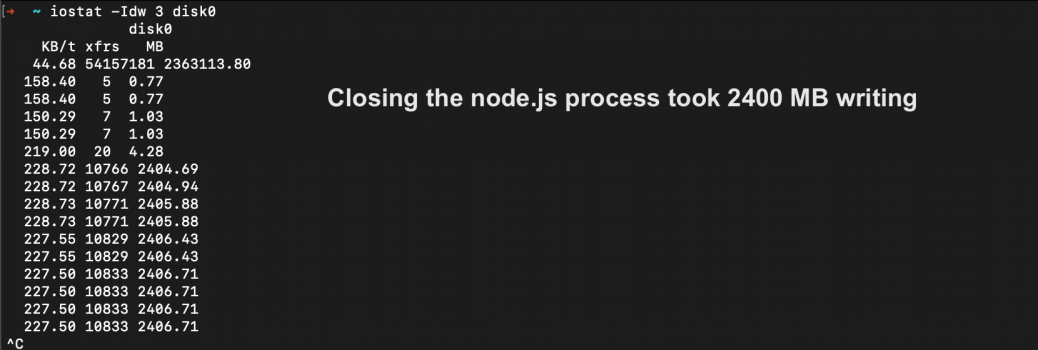
Looks like node version has nothing to do. Terminal is running in native mode (no rosetta), v15 suppose to support m1, v10 is very version (2018 if I remember correclty)
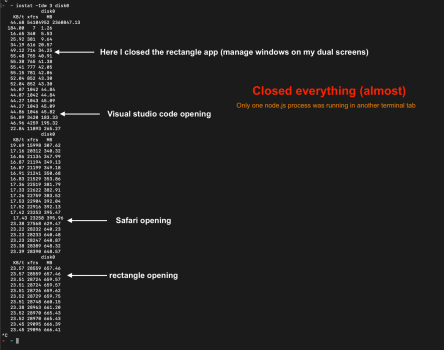
I will do more tests, but it's hard to read since the MB is showing both write and read.
I will do more tests, but it's hard to read since the MB is showing both write and read.
Attachments
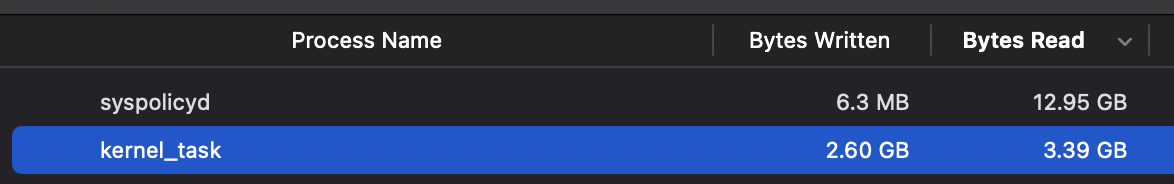
so an hour in, kernel_task is at 4.72 gig while being on a zoom this entire time. Last time I just rebooted and left the system alone before logging in , it was over 5GB. I'd be curious for some other folks to try this and see if it helps them as well.
Homebrew is just a package manager. Grab the source to smartmontools, reverse engineer and write your own if you don't trust something that's standard across multiple OS'.
https://github.com/Homebrew/homebrew-core/blob/HEAD/Formula/smartmontools.rb
Well, I tried their installer, which was horrifically broken, then Homebrew failed because of the first dead install. The uninstall command from the readme didn't work. Total SNAFU. A bunch of sudo later I got it working through Homebrew.
If anyone on this thread wants to install, don't use the .dmg installer. Use Homebrew and this command:
brew install smartmontools
AppleInsider has some unofficial comment from inside Apple:

 appleinsider.com
Furthermore I was curious what the SMART readout “Available Spare Threshold” means. And the Kingston site came up with this:
When the Available Spare falls below the threshold indicated in this field, an
asynchronous event completion may occur. The value is indicated as a normalized percentage (0 to 100%).
Now I observed that all the M1 Macs report this threshold to be 99%. In view of the above description this seems way too high. I searched online for more SMART reports (non Apple) and found many reporting a 10-12% threshold.
So taking this and the AppleInsider newsbit into consideration I am also inclined to doubt the SMART readouts of the M1s.
EDIT: I should have researched deeper before posting. Looks like the threshold determines when the system reports that spare cells have been used. Apple seems to want to inform us right at the beginning when they are used. But I stay open for correction by more knowledgeable people. Nonetheless my point about the threshold seems invalid. So forget it.
Questions raised about M1 Mac SSD longevity, based on incomplete data | AppleInsider
Complaints about the potential lifespan of Apple Silicon Mac storage are causing concern that the current crop of M1 Macs could stop working within a few years — and have been stoked by unanswered questions, unreliable data, and a silent Apple.
Furthermore I was curious what the SMART readout “Available Spare Threshold” means. And the Kingston site came up with this:
When the Available Spare falls below the threshold indicated in this field, an
asynchronous event completion may occur. The value is indicated as a normalized percentage (0 to 100%).
Now I observed that all the M1 Macs report this threshold to be 99%. In view of the above description this seems way too high. I searched online for more SMART reports (non Apple) and found many reporting a 10-12% threshold.
So taking this and the AppleInsider newsbit into consideration I am also inclined to doubt the SMART readouts of the M1s.
EDIT: I should have researched deeper before posting. Looks like the threshold determines when the system reports that spare cells have been used. Apple seems to want to inform us right at the beginning when they are used. But I stay open for correction by more knowledgeable people. Nonetheless my point about the threshold seems invalid. So forget it.
Last edited:
I have an Intel Mac showing it as 99%.AppleInsider has some unofficial comment from inside Apple:
Questions raised about M1 Mac SSD longevity, based on incomplete data | AppleInsider
Complaints about the potential lifespan of Apple Silicon Mac storage are causing concern that the current crop of M1 Macs could stop working within a few years — and have been stoked by unanswered questions, unreliable data, and a silent Apple.
Furthermore I was curious what the SMART readout “Available Spare Threshold” means. And the Kingston site came up with this:
When the Available Spare falls below the threshold indicated in this field, an
asynchronous event completion may occur. The value is indicated as a normalized percentage (0 to 100%).
Now I observed that all the M1 Macs report this threshold to be 99%. In view of the above description this seems way too high. I searched online for more SMART reports (non Apple) and found many reporting a 10-12% threshold.
So taking this and the AppleInsider newsbit into consideration I am also inclined to doubt the SMART readouts of the M1s.
Im at 3.9TBW in the same 2 monthsI'm at 2TBW after 2 months on my Macbook Pro M1 256GB...
Im at 3.9TBW in the same 2 months
Assuming you also have the 256GB config, then your Mac's SSD should last at least 64 years (1500 TBW / 3.9 TBW x 2 months).
That's assuming the NAND cells don't exceed the 6,000 P/E cycle rating (it's likely either that or 3,000 P/E cycles with 100% OP). I've seen Intel and Samsung SSDs reach average P/E cycles of I believe 20K P/E cycles on NAND that's only rated for 5,000.
SMART/Health Information (NVMe Log 0x02)
Critical Warning: 0x00
Temperature: 40 Celsius
Available Spare: 100%
Available Spare Threshold: 99%
Percentage Used: 0%
Data Units Read: 11,812,444 [6.04 TB]
Data Units Written: 6,106,094 [3.12 TB]
Host Read Commands: 118,011,593
Host Write Commands: 62,160,355
Controller Busy Time: 0
Power Cycles: 183
Power On Hours: 87
Unsafe Shutdowns: 12
Media and Data Integrity Errors: 0
Error Information Log Entries: 0
But I don't have any files written to icloud.
I am 99% close to buying the MBA M1. Should I postpone my purchase then?
Its confusing because many are panicking but many are also saying not to worry...
Wait and see plus it's more likely to be on sale. I got mine for less than MSRP last month but if I had been more patient I would've saved even more. It'll also give them time to fix the USB-C hub brick issue.
I am 99% close to buying the MBA M1. Should I postpone my purchase then?
Its confusing because many are panicking but many are also saying not to worry...
Just go with whatever option lets you sleep at night.
Personally, if it were me, I wouldn't be concerned.
Of course, I also used a Crucial m4 128GB on the HTPC as a live TV cache for pretty much 24/7 operation/writes (at 6-8GB per hour). Iirc, that SSD was still at ~60-70% when I replaced the HTPC with AppleTV 4th gen after 5-6 years of use. I believe that's the only SSD I own that went below 90% health before getting decommissioned/replaced by a bigger SSD.
My Windows OS SSDs (including the problematic 840 EVO with planar TLC) are still at 95+% health even after years of operation (~20GB/day host writes, 1.3-3x write amplification). Mind WA is high on the 840 EVO because charge decays after a while causing read slowdowns or even data loss after a few weeks/months. To circumvent this, Samsung released a firmware that rewrites the data every so often to keep it fast and fresh.
Register on MacRumors! This sidebar will go away, and you'll see fewer ads.