Yes, that indicates it is a blank chip. Do not attempt to program it with the P15 at this point, or it will not be usable. Just ensure that both chips you install are blank as described, and that you’ve installed the necessary passive components to utilize the second NAND. Then, you should be able to restore and have it work as expected. Though, the correct chip model for the BGA110 M2 systems should be HN3T3BTGCAX172, though it may just be the P15 software having a typo in its chip ID reference. Check the part number printed on the chips you have to verify.The P15 message is:
NAND model:HN3T3BTGCAX405_1TB
The hard disk has been detected. The hard disk is bound to the general state. After writing to the bottom layer, it can be installed and used.
What does it mean "After writing to the bottom layer, it can be installed and used." Can I use this IC's for upgrade M2 Air? Thank you
Got a tip for us?
Let us know
Become a MacRumors Supporter for $50/year with no ads, ability to filter front page stories, and private forums.
Apple Silicon Soldered SSD Upgrade Thread
- Thread starter dosdude1
- WikiPost WikiPost
- Start date
-
- Tags
- apple silicon nand upgrade
- Sort by reaction score
You are using an out of date browser. It may not display this or other websites correctly.
You should upgrade or use an alternative browser.
You should upgrade or use an alternative browser.
- Status
- The first post of this thread is a WikiPost and can be edited by anyone with the appropiate permissions. Your edits will be public.
yes it is 172 on the end. Thank youYes, that indicates it is a blank chip. Do not attempt to program it with the P15 at this point, or it will not be usable. Just ensure that both chips you install are blank as described, and that you’ve installed the necessary passive components to utilize the second NAND. Then, you should be able to restore and have it work as expected. Though, the correct chip model for the BGA110 M2 systems should be HN3T3BTGCAX172, though it may just be the P15 software having a typo in its chip ID reference. Check the part number printed on the chips you have to verify.
Unfortunately the K5A8 NAND's will not fit in the P15, the chip is too big. Are there two different sizes?
You have to remove the black insert in the BGA315 adapter to fit the larger chips. The removable insert is there so you can use both sizes.Unfortunately the K5A8 NAND's will not fit in the P15, the chip is too big. Are there two different sizes?
Thanks!You have to remove the black insert in the BGA315 adapter to fit the larger chips. The removable insert is there so you can use both sizes.
Probably not contributing much because I don't have any specific details or pictures.
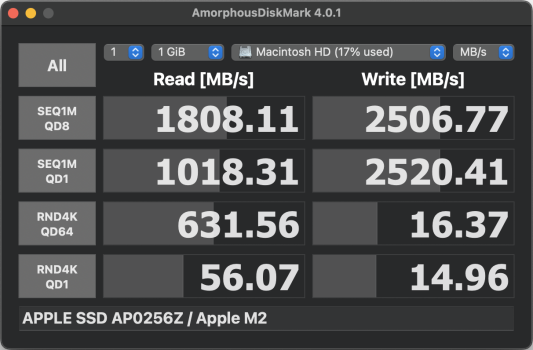
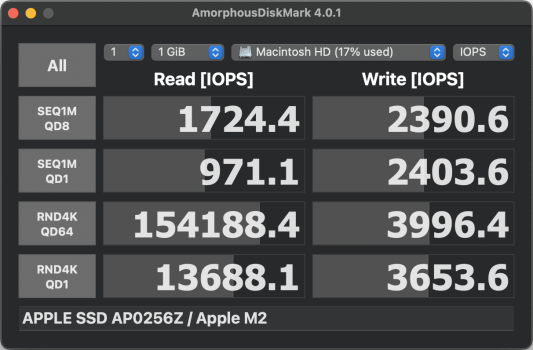
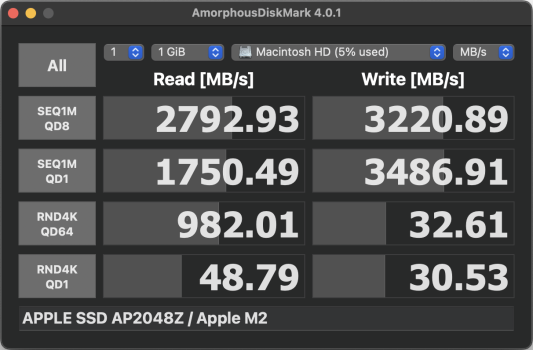
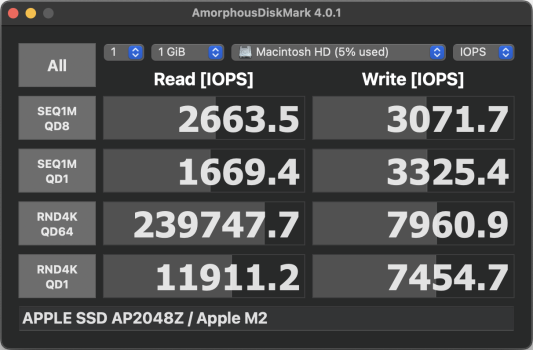
Got a base model 8GB/256GB M2 MacBook Air 13 A2681, paid AUD$629 for a 2TB NAND upgrade.
AJA with the 256GB W:2158 R:906
AJA with the 2TB W:3735 R:2165
Amorphous screenshots attached, I know running 1 test isn't ideal, repeated tests are kind of all over the place result wise anyway and I just wanted a rough comparison.
I thought the 4K random read might have improved instead of getting slightly worse?
Note: 256GB benchmarks were run on MacOS 15.1b5 (24B5055e), 2TB running 15.1RC (24B82) so there could be a firmware or software difference impacting results (doubt it).
The serial number and UUID reported in system information matches original, still reports 8 GPU cores, SSD power on hours was reported as 1 and there were under 100GB read and writes so I'm pretty confident they didn't just swap the logic board.
Attachments
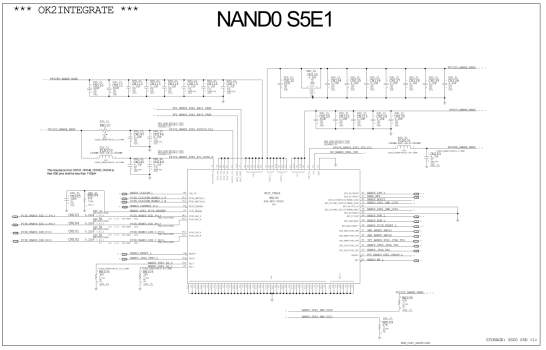
The mouser project that dosdude1 provide listed 2pcs of 49.9k ohm resistor and 2 pcs of 47k ohm resistor. but in the schematic i can only see 2 pcs 47ohm resistor And did not see where to put these 49.9 ohm resistor. It would be a great help if you can help me understand this.
thanks!
thanks!
Attachments
Last edited:
Some systems don't have the 49.9k resistors, but if they do usually they are shown on a different page of the schematic (but will still be designated with the correct BOM option code, such as "SSD_2L", etc.)The mouser project that dosdude1 provide listed 2pcs of 49.9k ohm resistor and 2 pcs of 47k ohm resistor. but in the schematic i can only see 2 pcs 47ohm resistor And did not see where to put these 49.9 ohm resistor. It would be a great help if you can help me understand this.
thanks!
ahh got it, after you mentioned on a different page i managed to find it under "SSD 24M CLOCK TERMINATIONS". Thanks for the reply! i would finally be doing the upgrade. finger crossed everything when smoothly!Some systems don't have the 49.9k resistors, but if they do usually they are shown on a different page of the schematic (but will still be designated with the correct BOM option code, such as "SSD_2L", etc.)
Attachments
Your queue depth 64 random read score got a lot better. QD1 random read/write scores are not too meaningful, imo.I thought the 4K random read might have improved instead of getting slightly worse?
QD1 means AmorphousDiskMark queues one 4K read or write, then waits for it to complete before queueing another. QD64 means it queues up to 64 random ops in parallel, then queues a replacement op whenever an earlier one completes - it tries to keep the queue of outstanding I/O operations at 64 deep.
A key fact about SSD architecture that's useful in understanding this: each NAND flash die is only capable of processing one read or write at a time (*). Adding more capacity to a SSD means more flash die (**), and that means more parallelism is available, since each die can work independently on its own I/O request. (You have to have access patterns that hit multiple die, of course.)
However, if your application software (Amorphous Disk Mark in this case) is limiting itself to a queue depth of 1, it doesn't matter how many die there are - the benchmark only exercises one die at a time. At QD64, it actually takes advantage of the SSD's parallelism and should show random IOPS scaling up with SSD size.
The slightly lower score at QD1 was probably just random variance. I bet if you had been able to collect a lot of data points at QD1 on both configurations, the median scores would look pretty much the same.
* - This was a bit of simplification on my part. Most NAND flash die are internally divided into at least two independent 'planes', each of which can handle one I/O at a time. Same thing in the end though, the division into planes just multiplies IOPS per die by a constant factor.
** - Unless the bigger SSD uses denser NAND flash (more capacity per die), which complicates things.
Not sure what is going on? Apple charges $Au 800 to upgrade a Mac Air from 256GB to 2TB. Would an Ebay yours and new one have been a better outcome? I understand a trade in from Apple would be under half its new buy price ...Probably not contributing much because I don't have any specific details or pictures.
Got a base model 8GB/256GB M2 MacBook Air 13 A2681, paid AUD$629 for a 2TB NAND upgrade.
AJA with the 256GB W:2158 R:906
AJA with the 2TB W:3735 R:2165
Amorphous screenshots attached, I know running 1 test isn't ideal, repeated tests are kind of all over the place result wise anyway and I just wanted a rough comparison.
I thought the 4K random read might have improved instead of getting slightly worse?
Note: 256GB benchmarks were run on MacOS 15.1b5 (24B5055e), 2TB running 15.1RC (24B82) so there could be a firmware or software difference impacting results (doubt it).
The serial number and UUID reported in system information matches original, still reports 8 GPU cores, SSD power on hours was reported as 1 and there were under 100GB read and writes so I'm pretty confident they didn't just swap the logic board.
2TB option from Apple is an AUD$1200 addition on the base model 13” MacBook Air.Not sure what is going on? Apple charges $Au 800 to upgrade a Mac Air from 256GB to 2TB. Would an Ebay yours and new one have been a better outcome? I understand a trade in from Apple would be under half its new buy price ...
I got my 13” MacBook Air M2 for AUD$800, mint condition, 30 cycles and 100% battery health, decided a nand upgrade was the cheaper and better option.
AUD$1429 total cost for my MacBook + nand upgrade.
Apple trade in would have been AUD$580 on mine.
AUD$2799 for a new 2TB 13” M2 from Apple.
AUD$2999 for a new 2TB 13” M3 from Apple.
I have not seen a 2TB for sale on eBay but I would say it would cost more than what i paid including the nand upgrade.
Last edited:
I must have had a brain fade and looked at $US prices.
These prices make me think Apple will never incorporate Thunderbolt 5.
These prices make me think Apple will never incorporate Thunderbolt 5.
iBoff RCC just made a custom PCB you install instead of the NAND modules, so you can swap out storage.
I mean, the idea is pretty cool but if you have to solder you might as well upgrade to the highest tier allowed on the base models 😅
I mean, the idea is pretty cool but if you have to solder you might as well upgrade to the highest tier allowed on the base models 😅
Im wondering for the Macbook Pro 14 M2 Pro, if i were to upgrade from 512GB to 1TB can i just put two extra K5A4? Or do i need to remove the original one and replace all with new blank chip?
You'd have to remove the other chips to at least program them with an appropriate dump for a 4x K5A4 config. I don't have a 4x K5A4 dump available yet, but someone else may.Im wondering for the Macbook Pro 14 M2 Pro, if i were to upgrade from 512GB to 1TB can i just put two extra K5A4? Or do i need to remove the original one and replace all with new blank chip?
Last edited:
On the main page for the m1, “only NAND0 (master NAND i assume this is the first nand UN000) needs to be blank”. So if i were to put the new blank K5A4 on NAND0, and move the original to the other pad should work right? Or this only applies to m1 not m2? Also on a diffrent topic, can i transplant used K5A4 NAND on to the same model of mac(placing it correctly in their respective pad) and just restore using apple configurator or i still need to reprogram it first?You'd have to remove the other chip to at least program it with an appropriate dump for a 2x K5A4 config. I don't have a 2x K5A4 dump available yet, but someone else may.
After the experimentation I've done over time, I don't think that is accurate. ALL chips need to either be blank or properly programmed, on all Apple Silicon-based models.On the main page for the m1, “only NAND0 (master NAND i assume this is the first nand UN000) needs to be blank”. So if i were to put the new blank K5A4 on NAND0, and move the original to the other pad should work right? Or this only applies to m1 not m2? Also on a diffrent topic, can i transplant used K5A4 NAND on to the same model of mac(placing it correctly in their respective pad) and just restore using apple configurator or i still need to reprogram it first?
I don't know if you can use a dump or programmed NAND for that position on another board and mix them like that, but I would assume that would not work. Though, it remains to be tested.
Last edited:
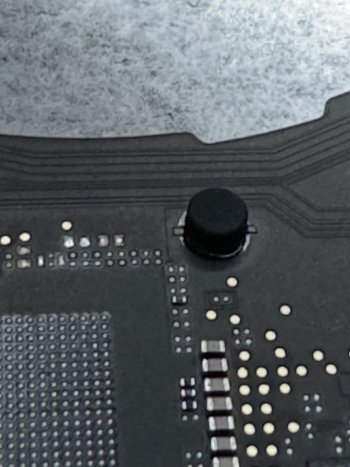
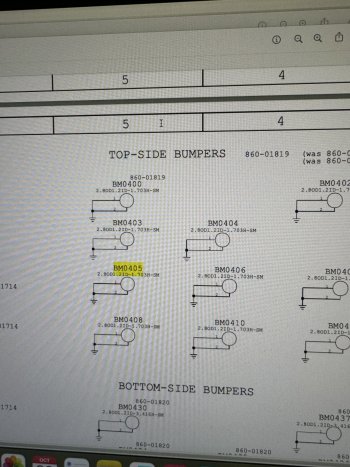
So im in the process of upgrading my MBP 14” M2. I am not sure how to remove this “Bumper” do i just pry it out by force(its really hard to pull out) or use heat or just leave it there. Its located very close to the NAND. Im afraid if i put a lot of heat near it. It will burn(rubber like material). I have checked the schematic it seems its connected to ground? Any info would be appreciated! Thanks!
Attachments
I just leave those there, they don’t burn. But if you want to remove it, put the board on a preheater in that spot and use a lot of heat. They have a lot of thermal mass and are directly soldered to the ground plane, so a lot of heat is required to remove. Do not just pull it out or you will likely damage the board.So im in the process of upgrading my MBP 14” M2. I am not sure how to remove this “Bumper” do i just pry it out by force(its really hard to pull out) or use heat or just leave it there. Its located very close to the NAND. Im afraid if i put a lot of heat near it. It will burn(rubber like material). I have checked the schematic it seems its connected to ground? Any info would be appreciated! Thanks!
@Rickyandika You can also try insulating it. Cover it in kapton tape and it won't get as hot. Don't limit yourself to just the bumper either - when using hot air, it's often a good idea to insulate all nearby components you don't want to reflow with kapton.
No, the passive components are the same on all models that I've worked on. On M3 Air with both NANDs already populated, installing 2x blank K5A8 NANDs should get you up and running.@dosdude1 Are different passive components needed for different NAND sizes? I have an M3 air with 512gb, would I be able to just swap the chips directly with 2x1tb chips?
An updated question regarding 49.9k resistor. I have just finished populating one nand pad(took me a good 6 hours, one more to go yay 😭) but then i just realized that there are a couple “empty” pad, when i check its all 49.9k resistor. In the mouser project, it only provides 2 of such resistor but it seems i need 4 for one landing pad? I have attached the resistor im infering about below. as far as i understand i need to populate every 49.9k resistor listed below here right?Some systems don't have the 49.9k resistors, but if they do usually they are shown on a different page of the schematic (but will still be designated with the correct BOM option code, such as "SSD_2L", etc.)
btw: my machine is mbp 14” M2 512GB(2 nand) upgrading to 2TB(4 nand). Thanks!
Attachments
They are 49.9 Ohm, not KOhm... Just to avoid any confusion. But yeah, looks like that board has 4 per chip instead of two like the boards I’ve worked on, so you’ll probably want to order a good number of extras of those. Looks like that board also has some 15 Ohm resistors not used in other boards either, which you’ll want to get as well.An updated question regarding 49.9k resistor. I have just finished populating one nand pad(took me a good 6 hours, one more to go yay 😭) but then i just realized that there are a couple “empty” pad, when i check its all 49.9k resistor. In the mouser project, it only provides 2 of such resistor but it seems i need 4 for one landing pad? I have attached the resistor im infering about below. as far as i understand i need to populate every 49.9k resistor listed below here right?
btw: my machine is mbp 14” M2 512GB(2 nand) upgrading to 2TB(4 nand). Thanks!
Register on MacRumors! This sidebar will go away, and you'll see fewer ads.


